Introduction
In this lab, you will use administrative tools to monitor and manage Windows system resources.
Recommended Equipment
- A Windows PC with Internet access
Part 1: Starting and Stopping the Routing and Remote Access service
You will explore what happens when a service is stopped and then started. In this part, you will use routing and remote access service as the example service. This service allows the local device to become a router or a remote access server.
a. Click Start > Search and select Control Panel > Click Network and Sharing Center.
Note: If your Control Panel is set to View by: Category, change it to View by: Large icons or View by: Small icons. This lab assumes that you are using one of these settings.
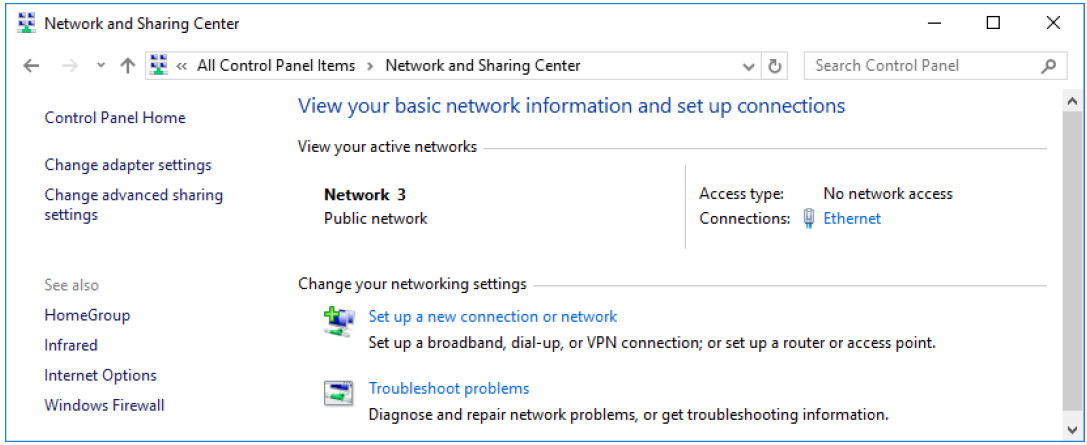
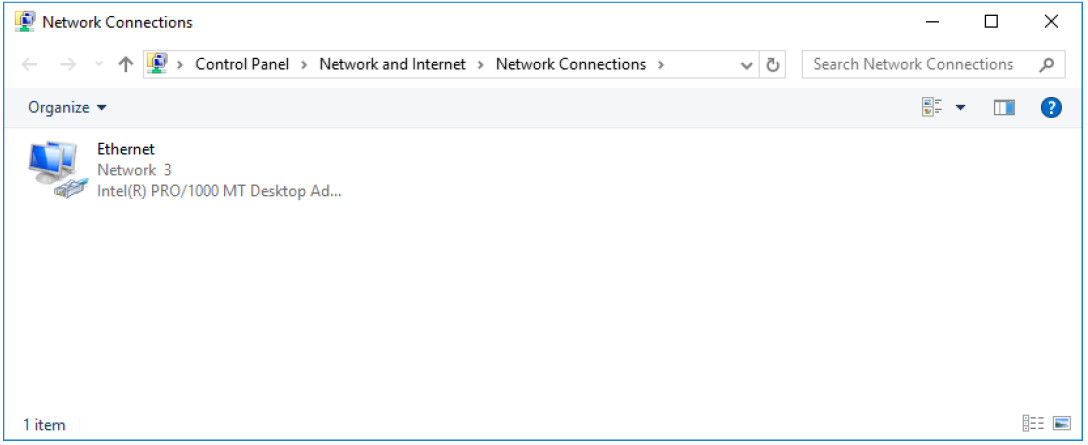
b. Click Change adapter settings in the left pane. Reduce the size of the Network Connections window and leave it open.
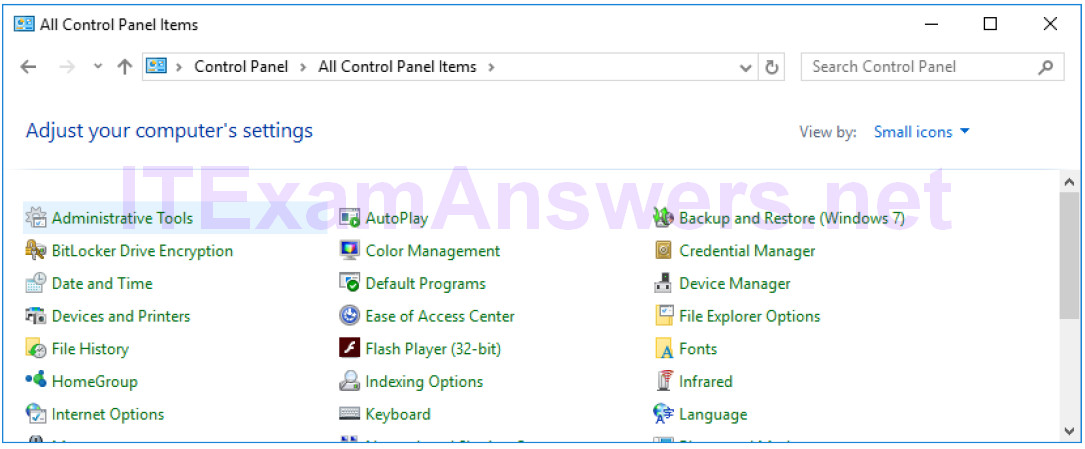
c. Navigate to the Administrative Tools. (Click Start > Search for and select Control Panel > Click Administrative Tools)
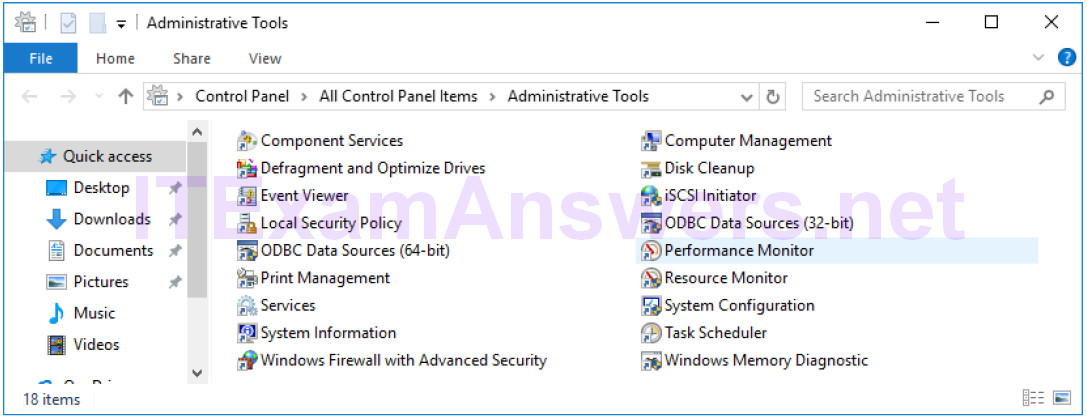
d. The Administrative Tools window opens. Double-click the Performance Monitor icon.
e. The Performance Monitor window opens. Make sure Performance Monitor in the left pane is highlighted. Click the Freeze Display icon (pause button) to stop the recording.
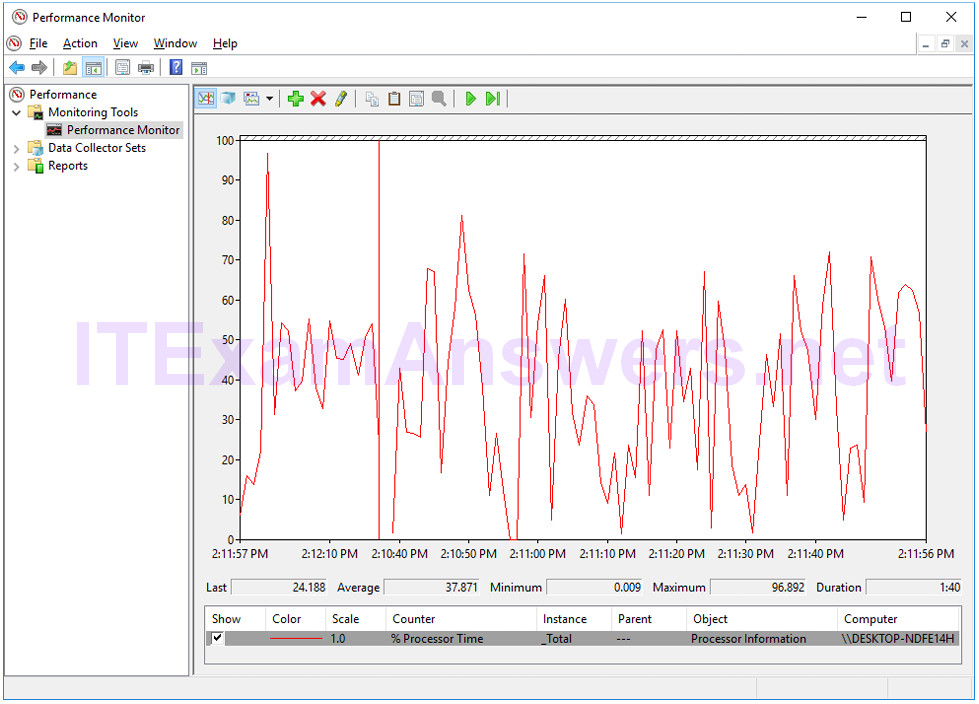
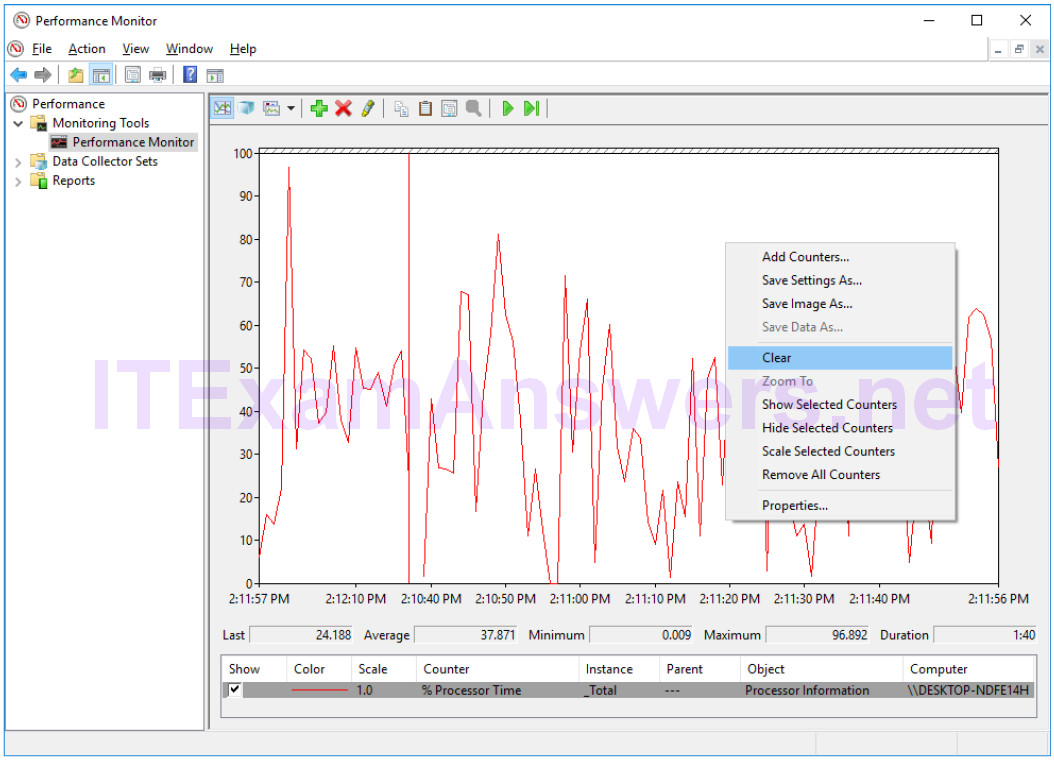
f. Right-click the Performance Monitor menu bar and select Clear to clear the graph. Leave this window open.
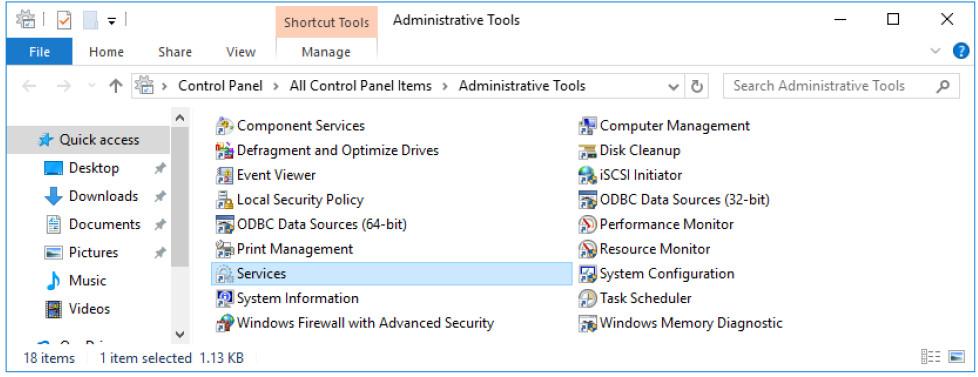
g. Navigate to the Administrative Tools window and select Services.
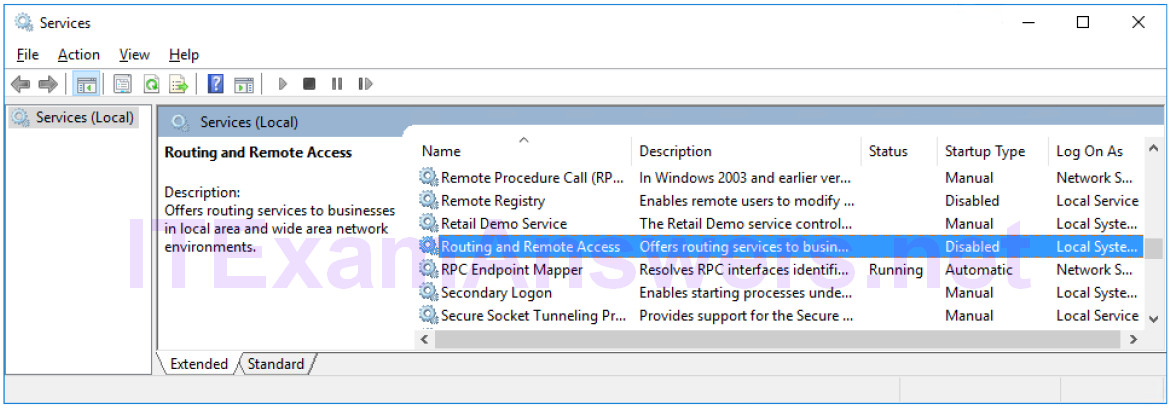
h. Expand the width of the Services window so you have a clear view of the content. Scroll down in the right pane until you see the service Routing and Remote Access. Double-click Routing and Remote Access.
i. The Routing and Remote Access Properties (Local Computer) window opens. In the Startup type drop-down field, select Manual and then click Apply.
The Start button is now active. Do NOT click the Start button yet. Leave this window open.
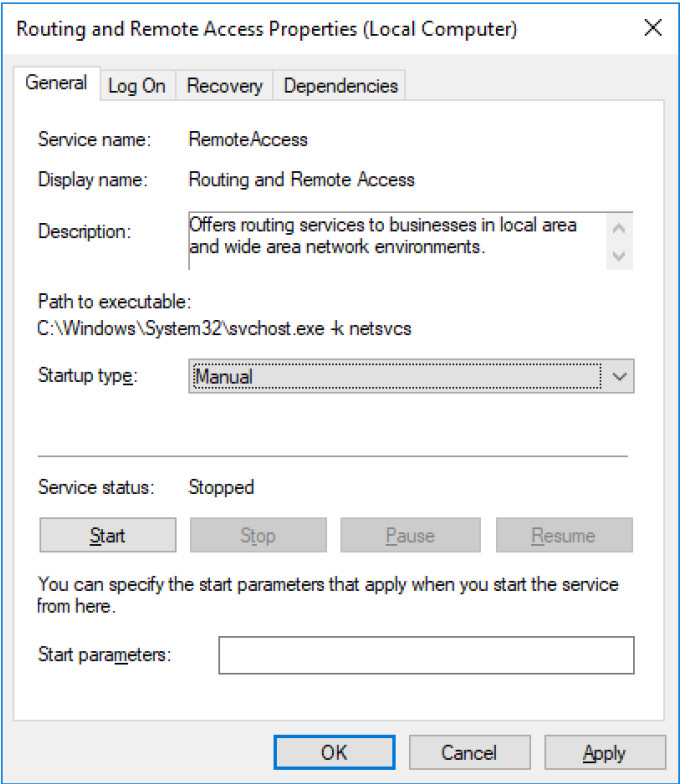
j. Navigate to Performance Monitor window. Click the Unfreeze Display icon to start the recording.
k. Click the Routing and Remote Access Properties (Local Computer) window. To start the service, click Start. A window with a progress bar opens.
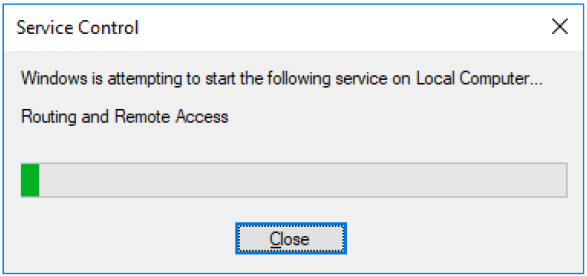
l. The Routing and Remote Access Properties (Local Computer) window now shows the Stop and Pause button active. Leave this window open
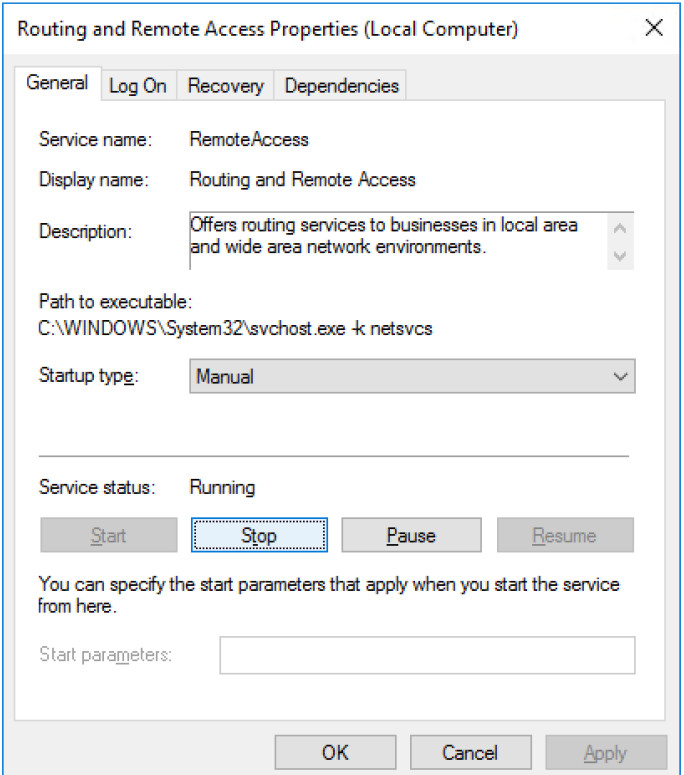
m. Navigate to Network Connections window. Press the function key F5 to refresh the content.
What changes appear in the window after starting the Routing and Remote Access service?
An Incoming Connections icon is now displayed.
n. Navigate to Routing and Remote Access Properties (Local Computer) window and click Stop.
o. Navigate to Network Connections window.
What changes appear in the right pane after stopping the Routing and Remote Access service?
The Incoming Connections icon is no longer displayed.
p. Navigate to Performance Monitor window and click the Freeze Display icon to stop the recording.
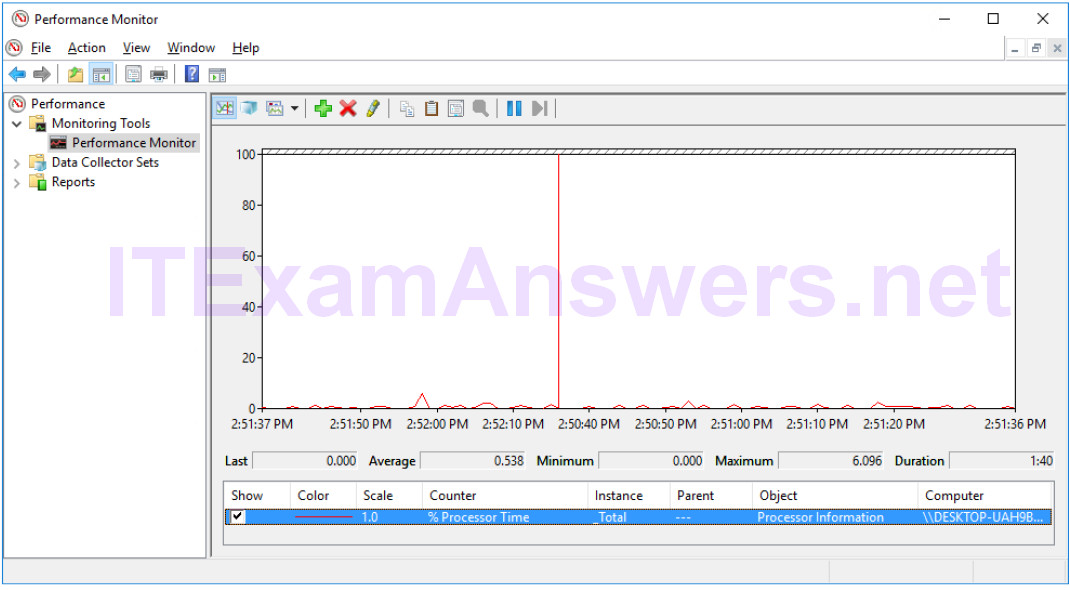
Which Counter is being recorded the most in the graph (hint: look at the graph color and Counter color)?
%Processor Time.
q. Click the Change graph type drop-down menu, select Report.
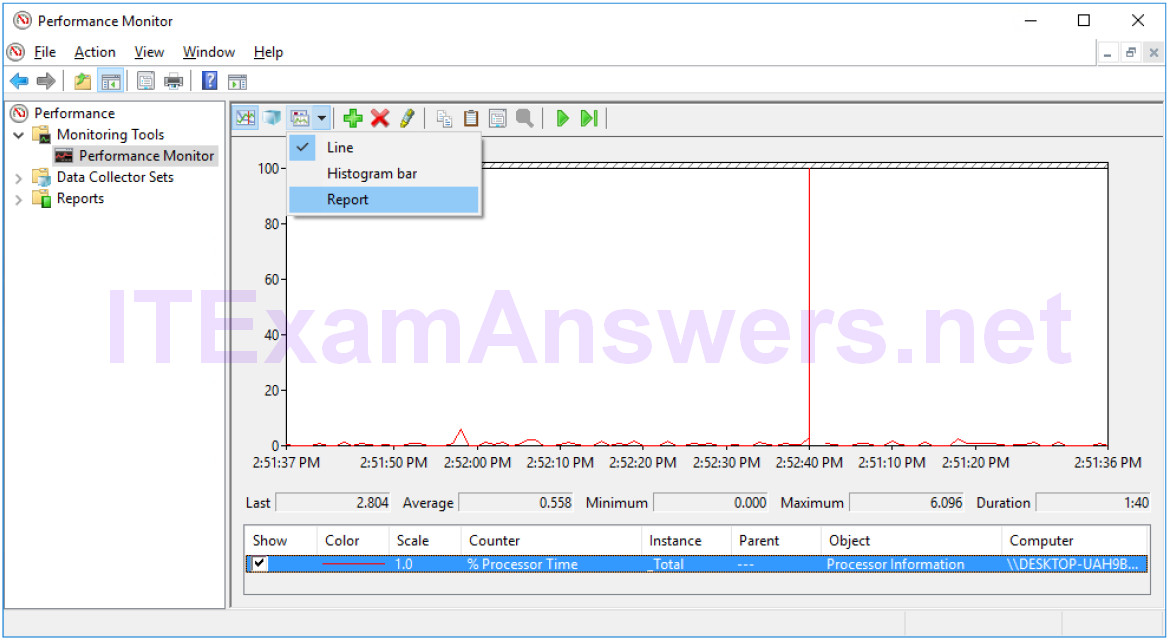
r. The display changes to report view.

What values are displayed by the counter?
Answers may vary. Processor Information % Processor Time: 2.804
s. Click the Routing and Remote Access Properties (Local Computer) window. In the Startup type field, select Disabled and click OK.
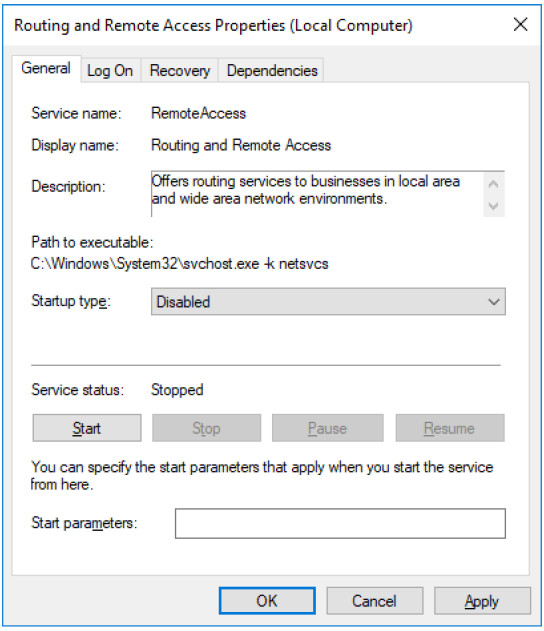
t. Click the Services window.
What is the Status and Startup Type for Routing and Remote Access?
Status is blank and Startup Type is Disabled.
u. Click the Performance Monitor window. Click the Unfreeze Display icon to start the recording.
v. Close all open windows you opened during Part 1 of this lab.
Part 2: Working in the Computer Management Utility
The Computer Management is used to manage a local or remote computer. The tools in this utility are grouped into three categories: system tools, storage, and services and applications.
a. Click Control Panel > Administrative Tools. Select Computer Management.
b. The Computer Management window opens. Expand the three categories by clicking on the arrow next to System Tools.
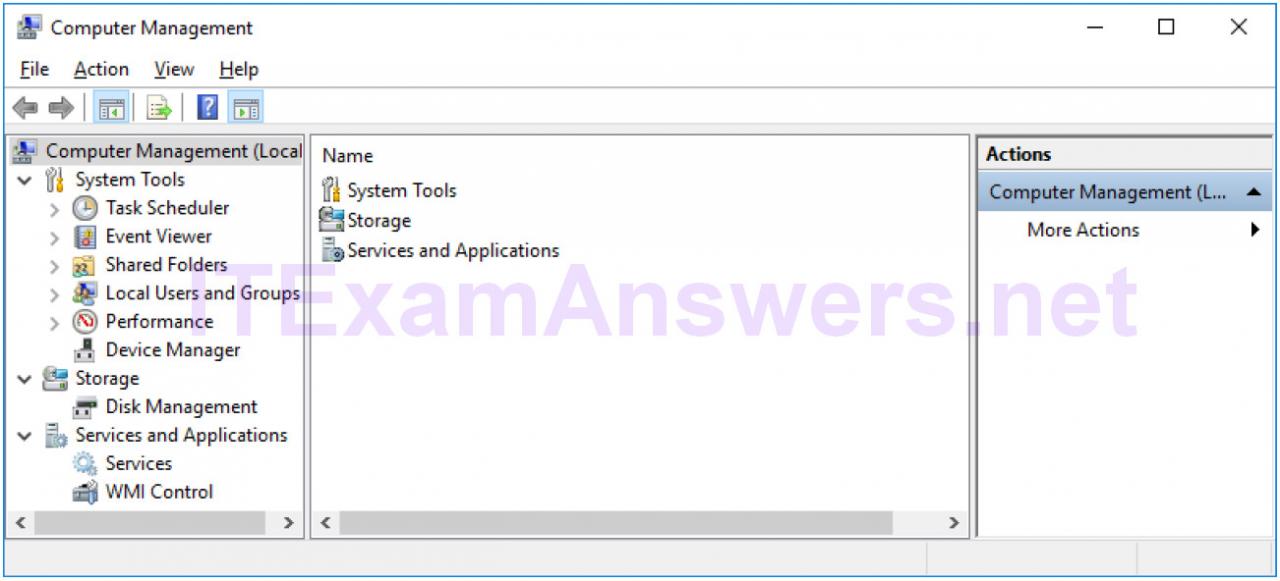
c. Click the arrow next to Event Viewer then click the arrow next to Windows Logs. Select System.
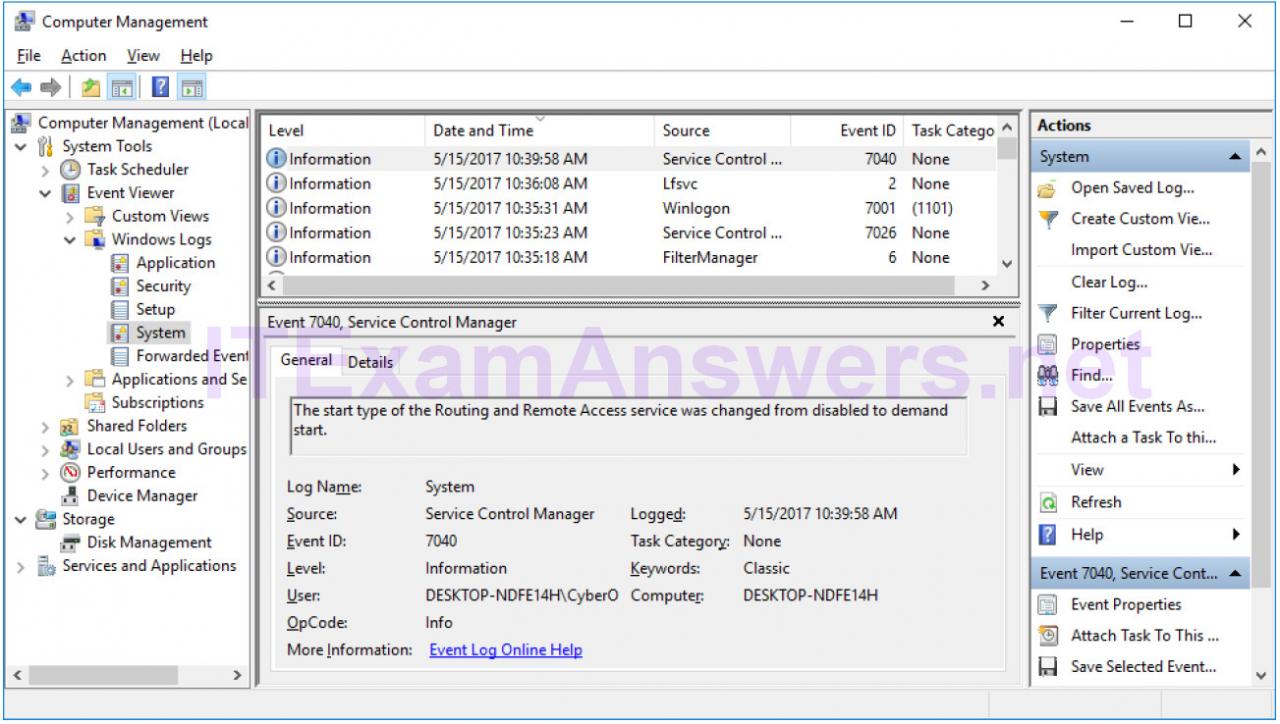
d. The Event Properties window opens for the first event. Click the down arrow key to locate an event for Routing and Remote Access. You should find four events that describe the order for starting and stopping the Routing and Remote Access service.
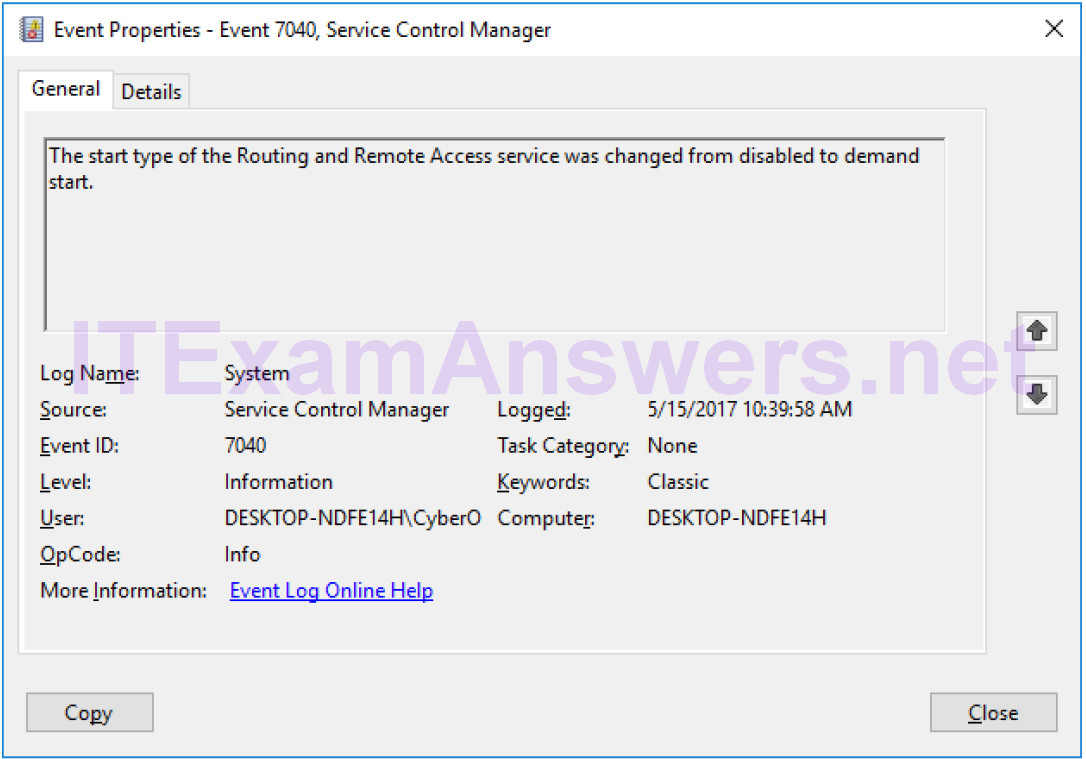
What are the descriptions for each of the four events?
Answers will vary.
e. Close all open windows.
Part 3: Configuring Administrative Tools
For the rest of this lab, you will configure Advanced Administrative Tool features and monitor how this affects the computer.
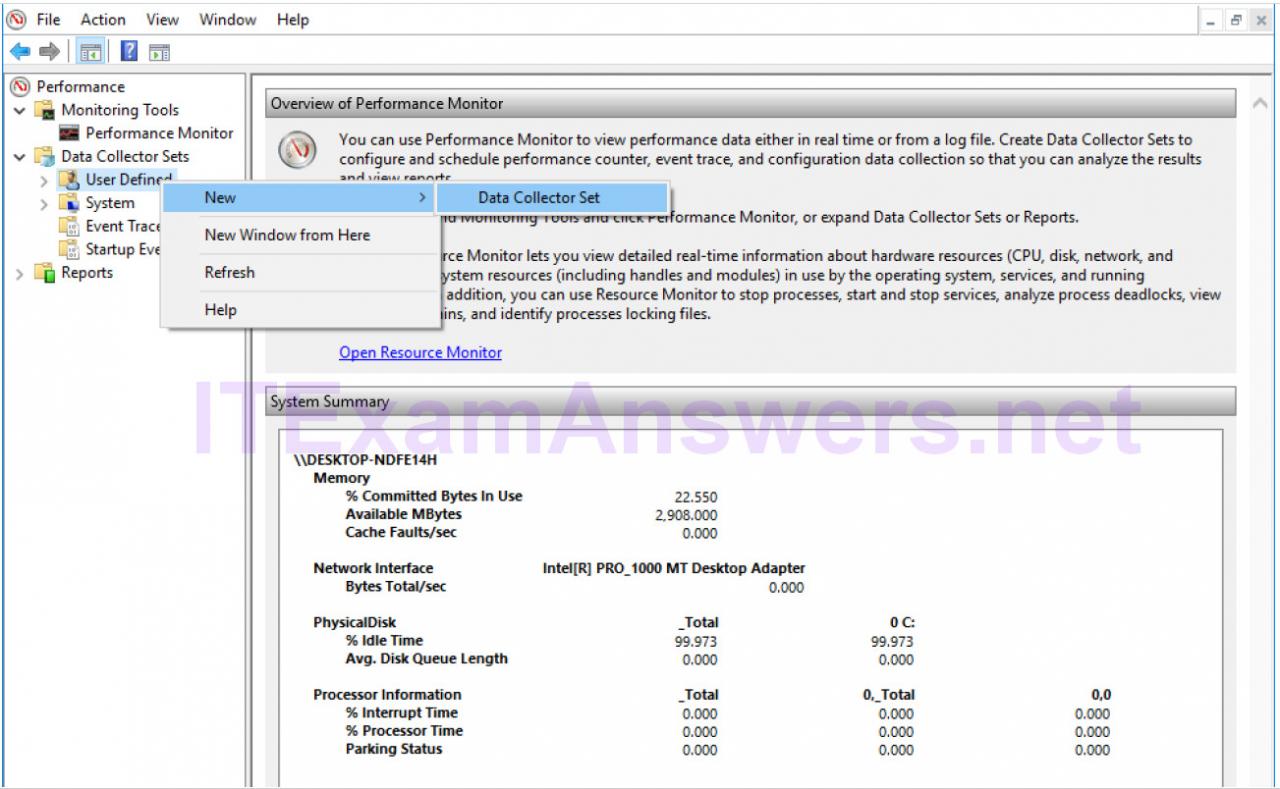
a. Click Control Panel > Administrative Tools > Performance Monitor. The Performance Monitor window opens. Expand Data Collector Sets. Right-click User Defined, and select New > Data Collector Set.
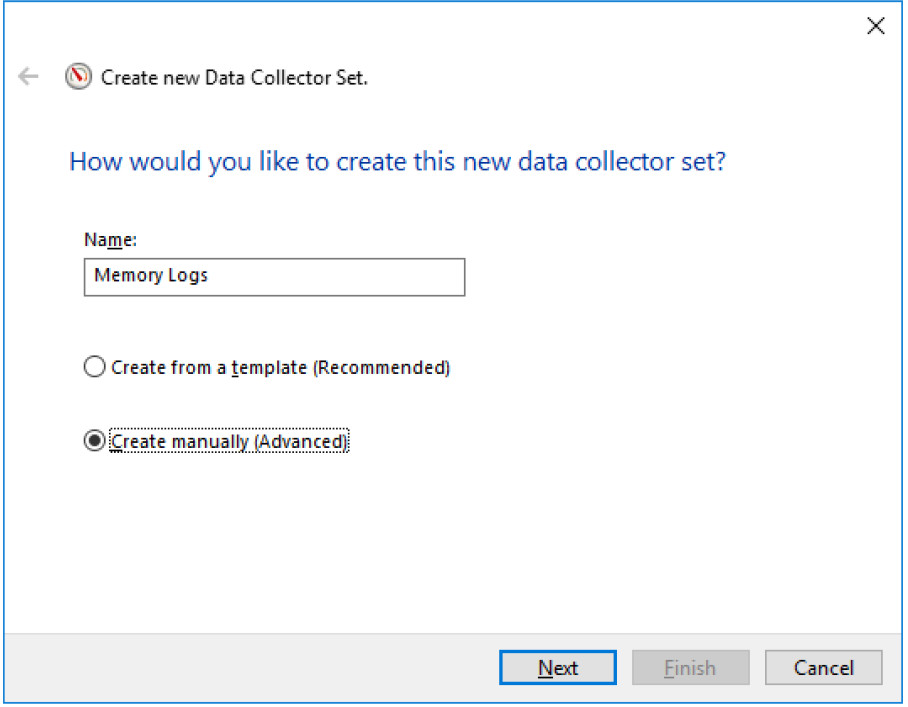
b. The Create new Data Collector Set window opens. In the Name field, type Memory Logs. Select the Create manually (Advanced) radio button, and click Next.
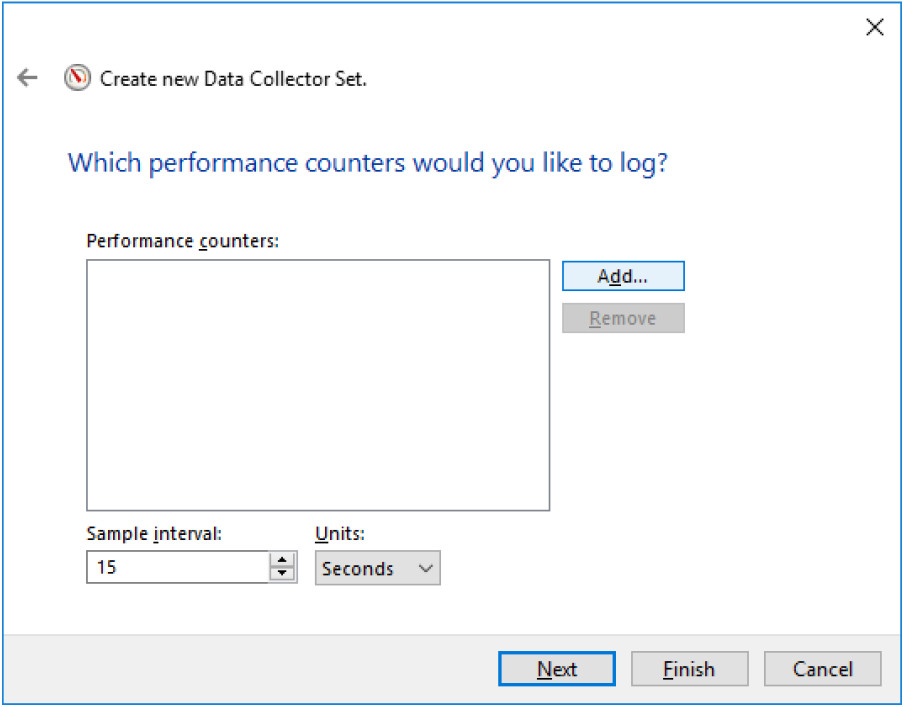
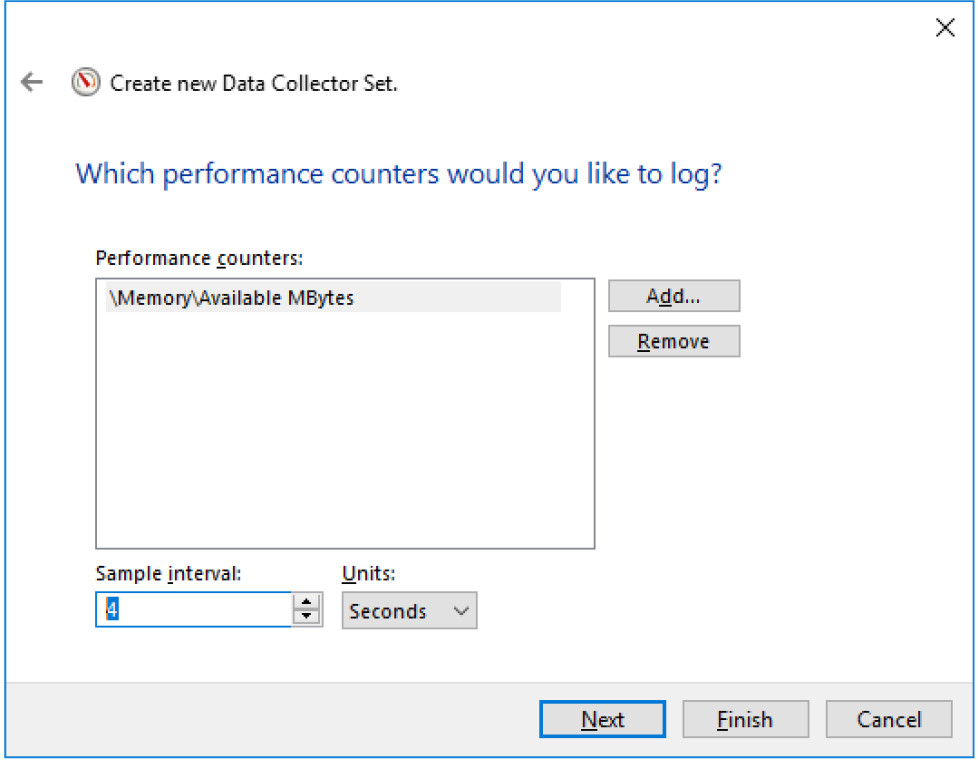
d. The Which performance counters would you like to log? screen opens. Click Add.
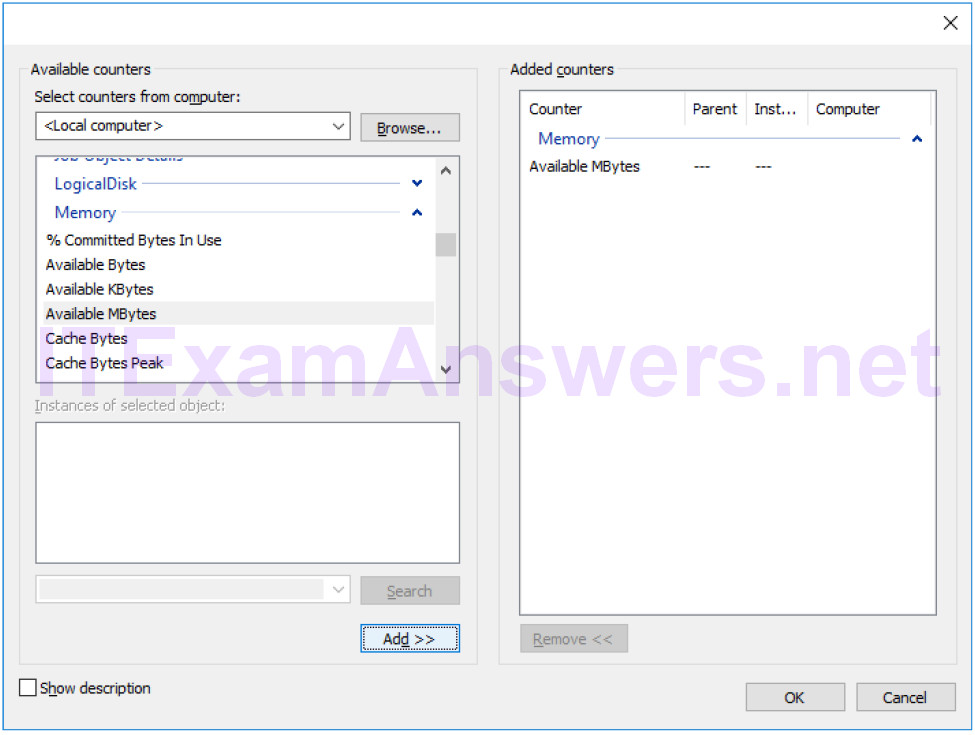
e. From the list of available counters, locate and expand Memory. Select Available MBytes and click Add>>.
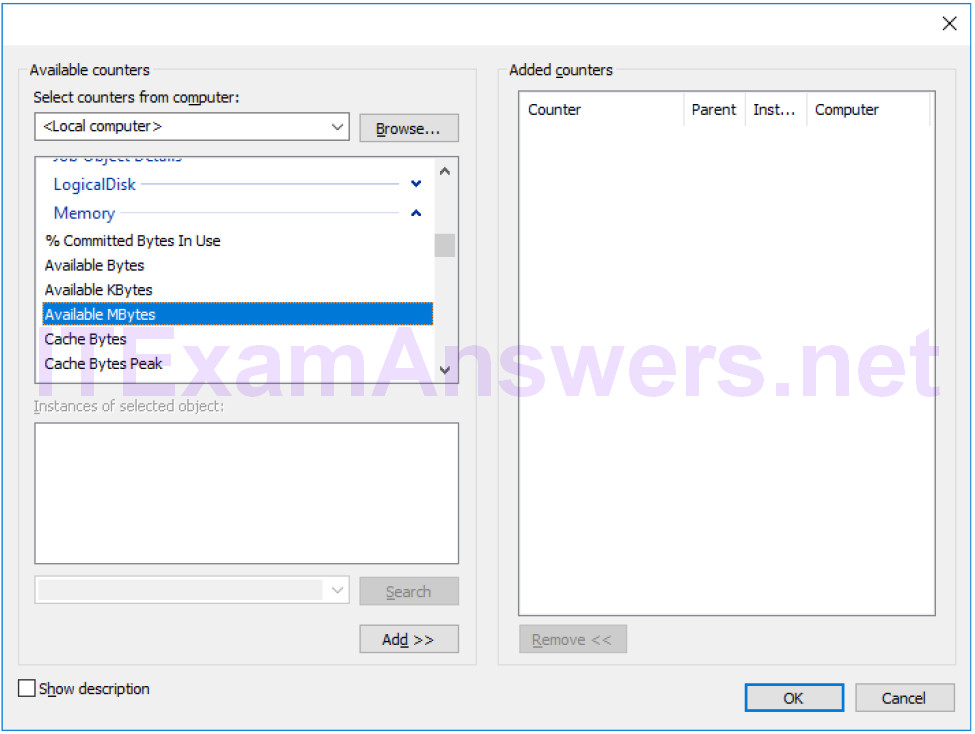
f. You should see the Available MBytes counter added in the right pane. Click OK.
g. Set the Sample interval field to 4 seconds. Click Next.
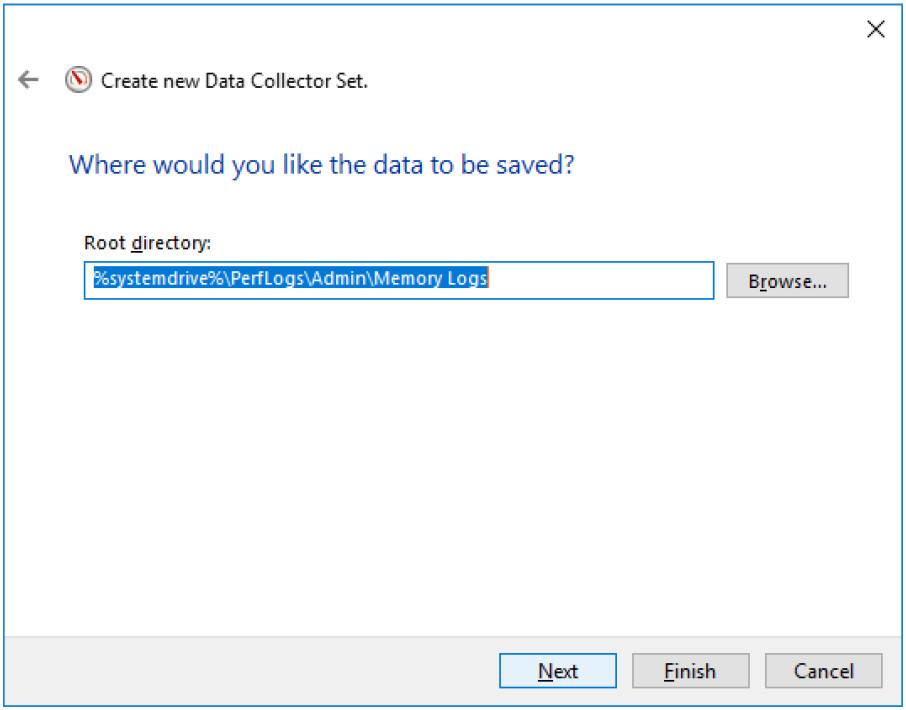
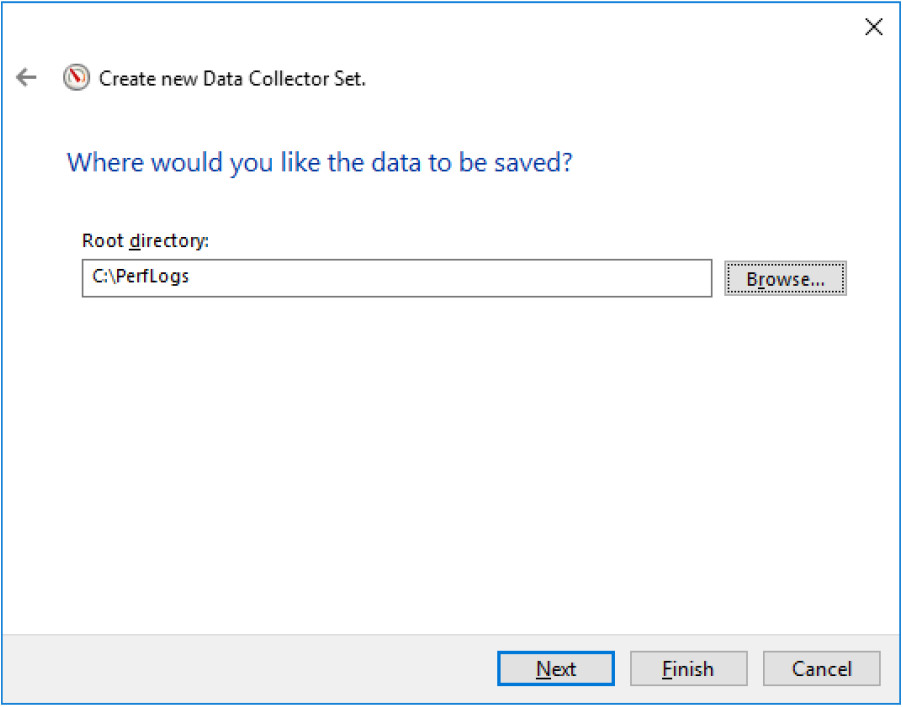
h. In the Where would you like the data to be saved? screen, click Browse.
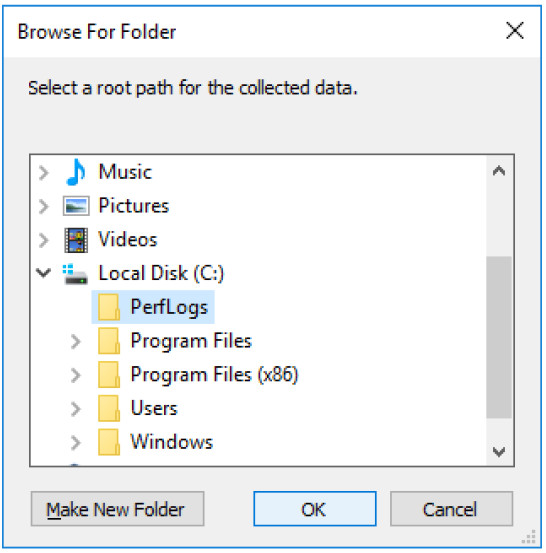
i. The Browse For Folder window opens. Select your (C:) drive which is Local Disk (C:) in the figure below. Select PerfLogs and click OK.
j. The Where would you like the data to be saved? window opens with the directory information that you selected in the previous step. Click Next.
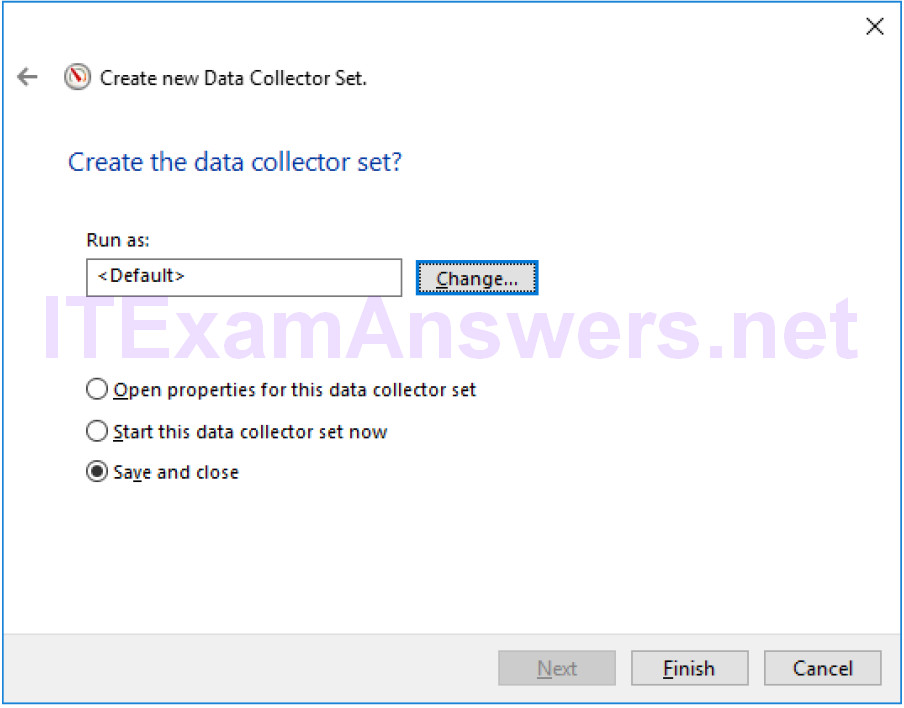
k. The Create the data collector set? screen opens. Click Finish.
l. Expand User Defined, and select Memory Logs. Right-click Data Collector01and select Properties.

m. The DataCollector01 Properties window opens. Change the Log format: field to Comma Separated.
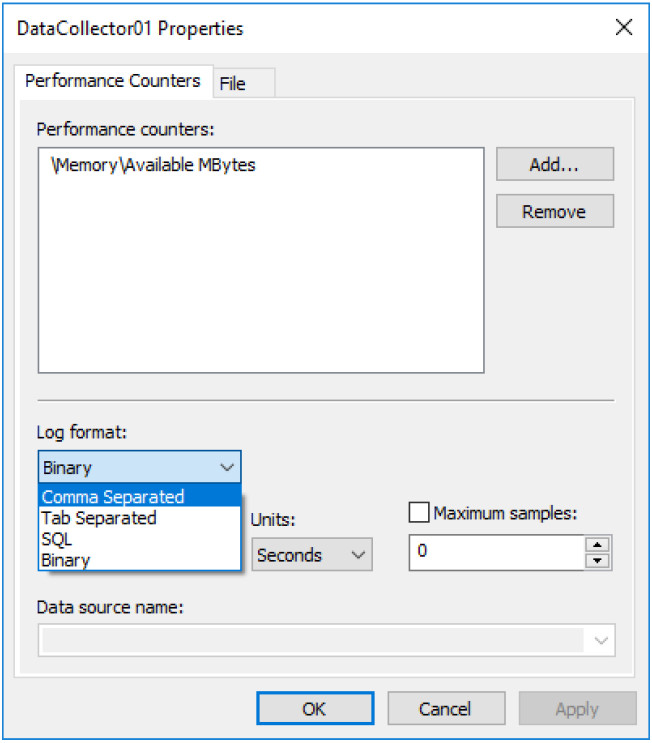
n. Click the File tab.
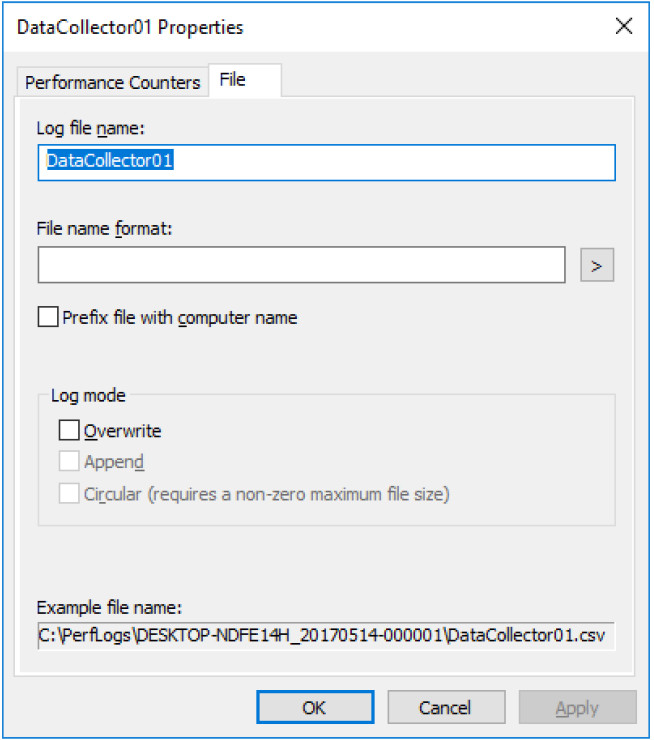
What is the full path name to the example file?
Answers may vary. In this example: C:PerfLogsDESKTOP-NDFE14H_20170514-000001DataCollector01.csv
o. Click OK.
p. Select the Memory Logs icon in the left pane of the Performance Monitor window. Click the green arrow icon to start the data collection set. Notice a green arrow is placed on top of the Memory Logs icon.

q. To force the computer to use some of the available memory, open and close a browser.
r. Click the black square icon to stop the data collection set.

What change do you notice for the Memory Logs icon?
The green arrow has been removed from the icon.
s. Click Start > Computer, and click drive C: > PerfLogs. Locate the folder that starts with your PC’s name followed by a timestamp, DESKTOP-NDFE14H_20170514-000001 in the example. Double-click the folder to open it, and then double-click the DataCollector01.csv file. If prompted, click Continue to permit access to the folder.

Note: If the Windows cannot open the file: message is displayed, select the radio button Select a program from a list of installed programs > OK > Notepad > OK.
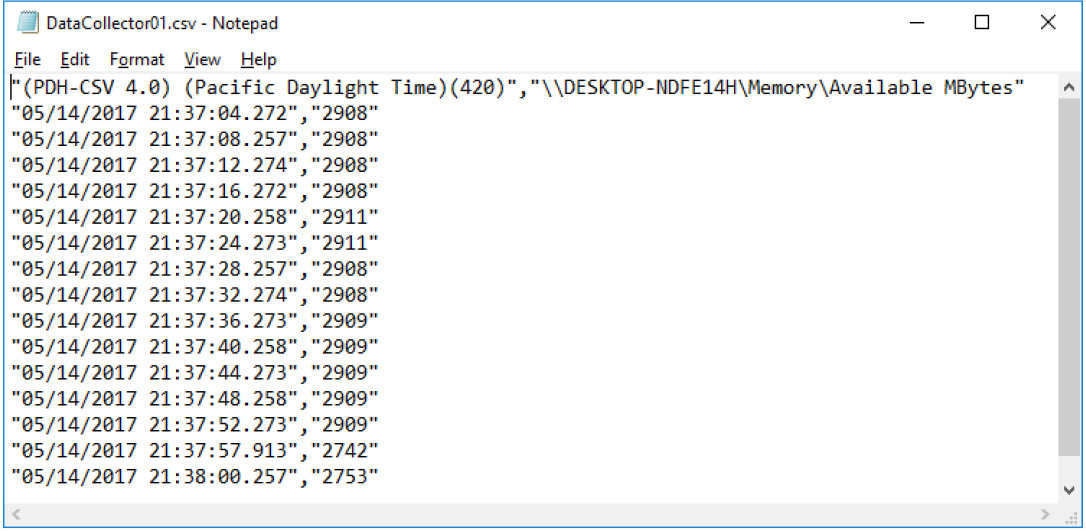
What does the column farthest to the right show?
Available memory in MBytes.
t. Close the DataCollector01.csv file and the window with the PerfLogs folder.
u. Select the Performance Monitor window. Right-click Memory Logs > Delete.

v. The Performance Monitor > Confirm Delete window opens. Click Yes.
w. Open drive C: > PerfLogs folder. Right-click on the folder that was created to hold the Memory log file, then click Delete.
x. The Delete Folder window opens. Click Yes.
y. Close all open windows.
