(Answers) 11.2.3.10 Packet Tracer – Explore a NetFlow Implementation
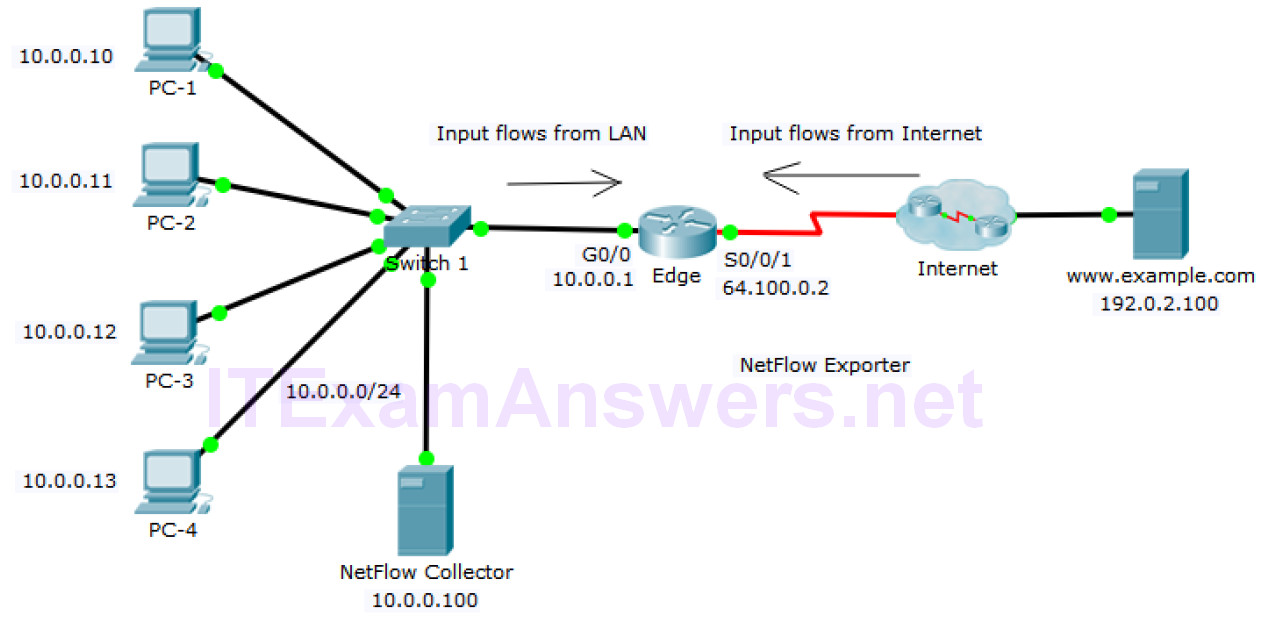
Topology
Objectives
- Part 1: Observe NetFlow Flow Records – One Direction
- Part 2: Observe NetFlow Records for a Session that Enters and Leaves the Collector
Background
In this activity, you will use Packet Tracer to create network traffic and observe the corresponding NetFlow flow records in a NetFlow collector. Packet Tracer offers a basic simulation of NetFlow functionality. It is not a replacement for learning NetFlow on physical equipment. Some differences may exist between NetFlow flow records generated by Packet Tracer and by records created by full-featured network equipment.
Part 1: Observe NetFlow Flow Records – One Direction
Step 1: Open the NetFlow collector.
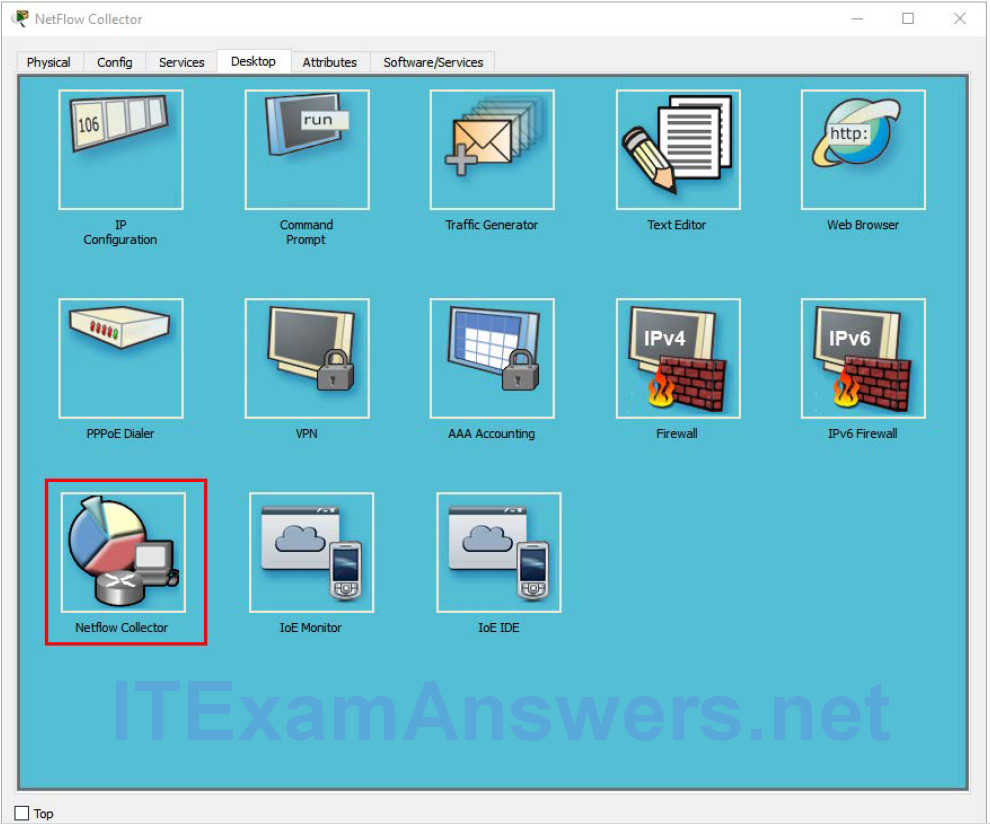
a. From the NetFlow Collector, click the Desktop tab. Click the Netflow Collector icon.
b. Click the “On” radio button to activate the collector as necessary. Position and size the window so that it is visible from the Packet Tracer topology window.
Step 2: Ping the default gateway from PC-1.
a. Click PC-1.
b. Open the Desktop tab and click the Command Prompt icon.
c. Enter the ping command to test connectivity to the default gateway at 10.0.0.1.
C:> ping 10.0.0.1
d. After a brief delay, the NetFlow Collector screen will display a pie chart.
Note: The first set of pings may not be sent to the NetFlow Collector because the ARP process must first resolve IP and MAC addresses. If after 30 seconds, a pie chart does not appear, ping the default gateway again.
e. Click either the pie chart or the legend entry to display the flow record details.
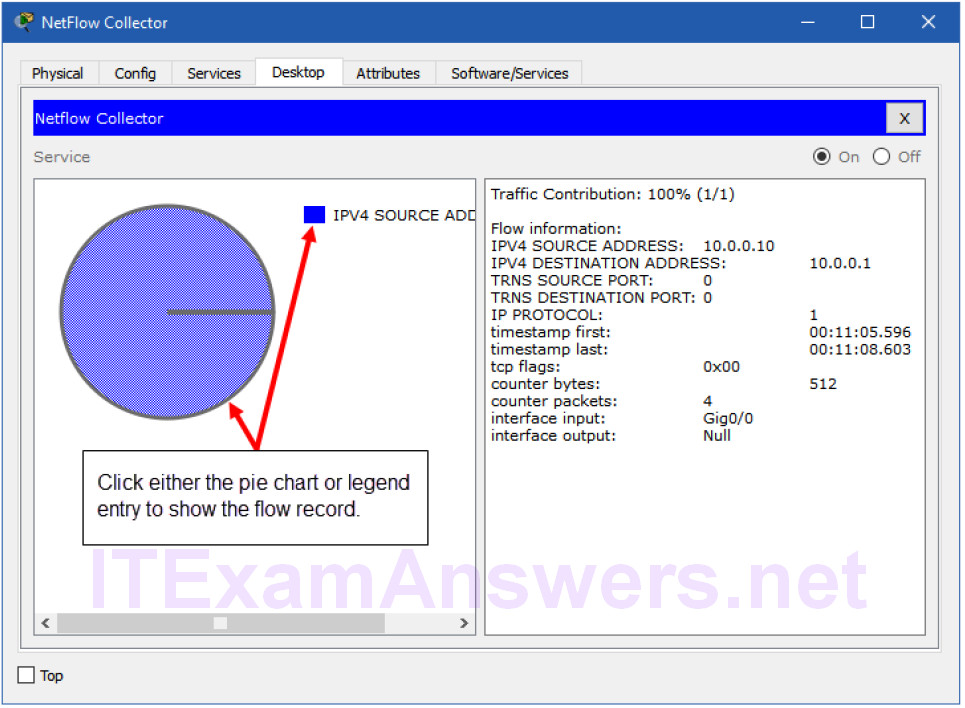
f. The flow record will have entries similar to those in the table below. Your timestamps will be different.
| Entry | Value | Explanation |
|---|---|---|
| Traffic contribution | 100% (1/1) | This is the proportion of all traffic represented by this flow. |
| IPV4 SOURCE ADDRESS | 10.0.0.10 | This is the source IP address of the flow packets. |
| IPV4 DESTINATION ADDRESS | 10.0.0.1 | This is the destination IP address of the flow packets. |
| TRNS SOURCE PORT | 0 | This is the transport layer source port. The value is 0 because this is an ICMP flow. |
| TRNS DESTINATION PORT | 0 | This is the transport layer destination port. The value is 0 because this is an ICMP flow. |
| IP PROTOCOL | 1 | This identifies Layer 4 service, typically 1 for ICMP, 6 for TCP, and 17 for UDP. |
| timestamp first | 00:47:49.593 | This is the timestamp for the beginning of the flow. |
| timestamp last | 00:47:52.598 | This is the timestamp for the last packet in the flow. |
| tcp flags | 0x00 | This is the TCP flag value. In this case, no TCP session was involved because the protocol is ICMP. |
| counter bytes | 512 | This is the number of bytes in the flow. |
| counter packets | 4 | This is the number of packets in the flow. |
| interface input | Gig0/0 | This is the interface of the flow exporter that collected the flow in the input direction (into the monitoring device interface). |
| interface output | Null | This is the interface of the flow exporter that collected the flow in the output direction (out of the monitoring device interface). The value is “Null” because this was a ping to the input interface. |
In this case, the flow represents the ICMP ping from host 10.0.0.10 to 10.0.0.1. Four ping packets were in the flow. The packets entered interface Gig0/0 of the exporter.
Note: In this activity, the Edge router has been configured as a NetFlow flow exporter. The LAN interface is configured to monitor flows that enter it from the LAN. The serial interface has been configured to collect flows that enter it from the Internet. This has been done to simplify this activity.
To see traffic that matches a full bi-directional session, the NetFlow exporter would need to be configured to collect flows entering and leaving a network.
Step 3: Create additional traffic.
a. Click PC-2 > Desktop.
b. Open a command prompt and ping the default gateway 10.0.0.1.
What do you expect to see in the NetFlow collector flow records? Will the statistics for the existing flow record change, or will a new flow appear in the pie chart? __________________________________________________________________
c. Return to PC-1 and repeat the ping to the gateway.
How will this traffic be represented? As a new segment in the pie chart or will it modify the values in the existing flow record? __________________________________________________________________
d. Issue pings from PC-3 and PC-4 to the default gateway address.
What should happen to the display in the flow collector? __________________________________________________________________
Part 2: Observe NetFlow Records for a Session that Enters and Leaves the Collector
The NetFlow exporter has been configured to collect flows that exit the LAN and enter the router from the Internet.
Step 1: Access the Web Server by IP Address.
Before continuing, power cycle the NetFlow Collector to clear the flows.
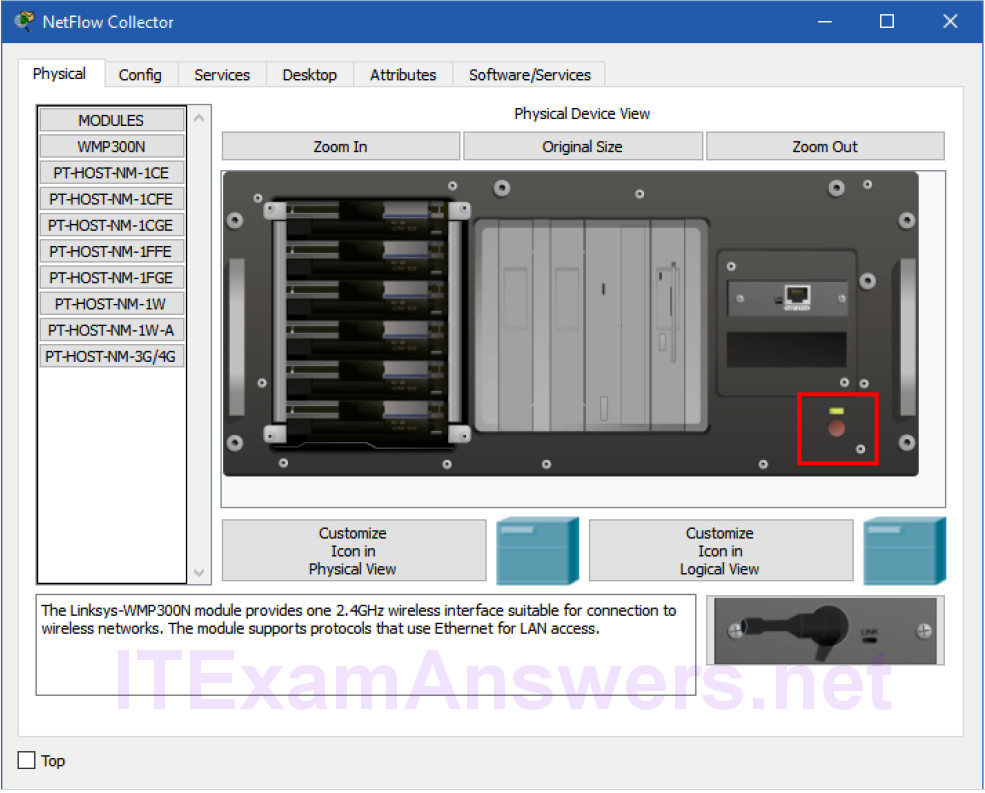
a. Click NetFlow Collector > Physical tab.
b. Click the red power button to turn off the server. Then click it again to turn the server back on.
c. From the NetFlow Collector, click the Desktop tab.
d. Click the Netflow Collector icon. Click the “On” radio button to activate the collector. Close the NetFlow Collector window.
e. Before you access a web server from PC-1, predict how many flows will there be in the pie chart?
Explain. __________________________________________________________________
From your knowledge of network protocols and NetFlow, predict the values for the web page requests leaving the LAN.
| Record Field | Value | Guidelines |
|---|---|---|
| Source IP address | ||
| Destination IP address | ||
| Source Port | 1025–5000 (MS Windows default, which is what PT uses. | This is an approximate value that is dynamically created. |
| Destination Port | ||
| Input Interface | ||
| Output Interface |
Predict the values for the web page reply entering the NetFlow exporter router from the Internet.
| Record Field | Value | Guidelines |
|---|---|---|
| Source IP address | ||
| Destination IP address | ||
| Source Port | 1025–5000 | This is whatever value was randomly |
| Destination Port | ||
| Input Interface | ||
| Output Interface |
f. Click PC-1 > Desktop. Close the Command Prompt window, if necessary. Click the Web Browser icon.
g. In the Web Browser for PC-1, enter 192.0.2.100 and click Go. The Example Website webpage will display.
h. After a short delay, a new pie chart will appear in the NetFlow collector. You will see at least two pie segments for the HTTP request and response. You might see a third segment if the ARP cache for PC-1 timed out.
i. Click each HTTP pie segment to display the record and verify your predictions.
j. Click the link to the Copyrights page.
What happened? Explain. (Hint: compare the port number on the host for the flows.) __________________________________________________________________
Compare the flows. Aside from the obvious timestamp, source and destination IP address, port, and interfaces, differences, what else is different between the request and response flows? __________________________________________________________________
Step 2: Access the Web Server by URL.
a. Power cycle the NetFlow Collector to clear the flows.
b. Turn on the Netflow Collector service.
c. Before you access the Web Server by its URL. What do you think you will see in the NetFlow collector display? __________________________________________________________________
d. On PC-1, enter www.example.com in the URL field and press Go.
e. After the flows are displayed, inspect each flow record.
What values do you see for the IP protocol field of the flow record? What do these values mean? __________________________________________________________________
Suggested Scoring Rubric
| Record Field | Value | Guidelines |
|---|---|---|
| Part 1, Step 3b | 10 | |
| Part 1, Step 3c | 10 | |
| Part 1, Step 3d | 10 | |
| Part 2, Step 1f | 30 | |
| Part 2, Step 1j | 30 | |
| Part 2, Step 2c | 10 | |
| Total Score | 100 |