26.1.7 Lab – Snort and Firewall Rules (Instructor Version)
Instructor Note: Red font color or gray highlights indicate text that appears in the instructor copy only.
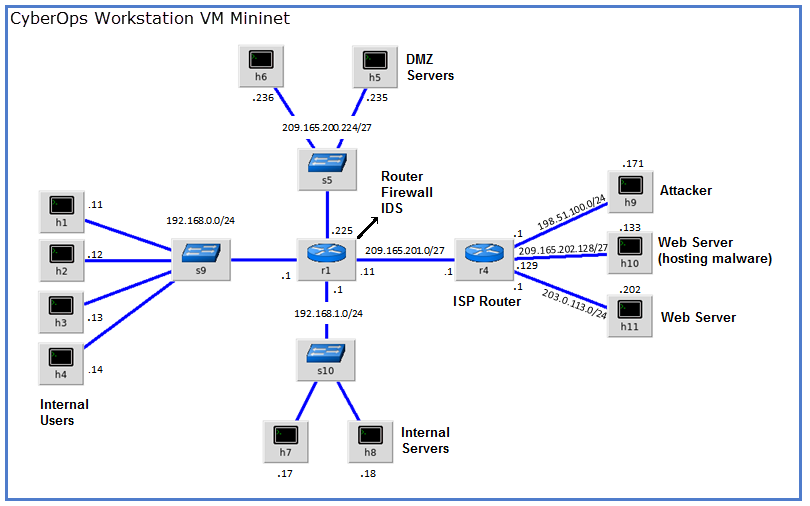
Topology

Objectives
- Part 1: Preparing the Virtual Environment
- Part 2: Firewall and IDS Logs
- Part 3: Terminate and Clear Mininet Process
Background / Scenario
In a secure production network, network alerts are generated by various types of devices such as security appliances, firewalls, IPS devices, routers, switches, servers, and more. The problem is that not all alerts are created equally. For example, alerts generated by a server and alerts generated by a firewall will be different and vary in content and format.
In this lab, to get familiar with firewall rules and IDS signatures.
Required Resources
- CyberOps Workstation virtual machine
- Internet connection
Note: In this lab, the CyberOps Workstation VM is a container for holding the Mininet environment shown in the Topology. If a memory error is received in an attempt to run any command, quit out of the step, go to the VM settings, and increase the memory. The default is 1 GB; try 2GB.
Instructions
Part 1: Preparing the Virtual Environment
a. Launch Oracle VirtualBox and change the CyberOps Workstation for Bridged mode, if necessary. Select Machine > Settings > Network. Under Attached To, select Bridged Adapter (or if you are using WiFi with a proxy, you may need NAT adapter) and click OK.
b. Launch the CyberOps Workstation VM, open a terminal and configure its network by executing the sh script.
Because the script requires super-user privileges, provide the password for the user analyst.
[analyst@secOps ~]$ sudo ./lab.support.files/scripts/configure_as_dhcp.sh
[sudo] password for analyst:
[analyst@secOps ~]$
c. Use the ifconfig command to verify CyberOps Workstation VM now has an IP address on your local network. You can also test connectivity to a public webserver by pinging www.cisco.com. Use Ctrl+C to stop the pings.
[analyst@secOps ~]$ ping www.cisco.com
PING e2867.dsca.akamaiedge.net (23.204.15.199) 56(84) bytes of data.
64 bytes from a23-204-15-199.deploy.static.akamaitechnologies.com (23.204.15.199): icmp_seq=1 ttl=54 time=28.4 ms
64 bytes from a23-204-15-199.deploy.static.akamaitechnologies.com (23.204.15.199): icmp_seq=2 ttl=54 time=35.5 ms
^C
--- e2867.dsca.akamaiedge.net ping statistics ---
2 packets transmitted, 2 received, 0% packet loss, time 1002ms
rtt min/avg/max/mdev = 28.446/32.020/35.595/3.578 ms
Part 2: Firewall and IDS Logs
Firewalls and Intrusion Detection Systems (IDS) are often deployed to partially automate the traffic monitoring task. Both firewalls and IDSs match incoming traffic against administrative rules. Firewalls usually compare the packet header against a rule set while IDSs often use the packet payload for rule set comparison. Because firewalls and IDSs apply the pre-defined rules to different portions of the IP packet, IDS and firewall rules have different structures.
While there is a difference in rule structure, some similarities between the components of the rules remain. For example, both firewall and IDS rules contain matching components and action components. Actions are taken after a match is found.
- Matching component – specifies the packet elements of interest, such as: packet source; the packet destination; transport layer protocols and ports; and data included in the packet payload.
- Action component – specifies what should be done with that packet that matches a component, such as: accept and forward the packet; drop the packet; or send the packet to a secondary rule set for further inspection.
A common firewall design is to drop packets by default while manually specifying what traffic should be allowed. Known as dropping-by-default, this design has the advantage protecting the network from unknown protocols and attacks. As part of this design, it is common to log the events of dropped packets since these are packets that were not explicitly allowed and therefore, infringe on the organization’s policies. Such events should be recorded for future analysis.
Step 1: Real-Time IDS Log Monitoring
a. From the CyberOps Workstation VM, run the script to start mininet.
[analyst@secOps ~]$ sudo ./lab.support.files/scripts/cyberops_extended_topo_no_fw.py
[sudo] password for analyst:
*** Adding controller
*** Add switches
*** Add hosts
*** Add links
*** Starting network
*** Configuring hosts
R1 R4 H1 H2 H3 H4 H5 H6 H7 H8 H9 H10 H11
*** Starting controllers
*** Starting switches
*** Add routes
*** Post configure switches and hosts
*** Starting CLI:
mininet>
The mininet prompt should be displayed, indicating mininet is ready for commands.
b. From the mininet prompt, open a shell on R1 using the command below:
mininet> xterm R1
mininet>
The R1 shell opens in a terminal window with black text and white background. What user is logged into that shell? What is the indicator of this?
c. From R1’s shell, start the Linux-based IDS, Snort.
[root@secOps analyst]# ./lab.support.files/scripts/start_snort.sh
Running in IDS mode
--== Initializing Snort ==--
Initializing Output Plugins!
Initializing Preprocessors!
Initializing Plug-ins!
Parsing Rules file "/etc/snort/snort.conf"
<output omitted>
Note: You will not see a prompt as Snort is now running in this window. If for any reason, Snort stops running and the [root@secOps analysts]# prompt is displayed, rerun the script to launch Snort. Snort must be running to capture alerts later in the lab.
d. From the CyberOps Workstation VM mininet prompt, open shells for hosts H5 and H10.
mininet> xterm H5
mininet> xterm H10
mininet>
e. H10 will simulate a server on the Internet that is hosting malware. On H10, run the mal_server_start.sh script to start the server.
[root@secOps analyst]# ./lab.support.files/scripts/mal_server_start.sh
[root@secOps analyst]#
f. On H10, use netstat with the -tunpa options to verify that the web server is running. When used as shown below, netstat lists all ports currently assigned to services:
[root@secOps analyst]# netstat -tunpa
Active Internet connections (servers and established)
Proto Recv-Q Send-Q Local Address           Foreign Address         State       PID/Program name
tcp        0      0 0.0.0.0:6666            0.0.0.0:*               LISTEN      1839/nginx: master
[root@secOps analyst]#
As seen by the output above, the lightweight webserver nginx is running and listening to connections on port TCP 6666.
g. In the R1 terminal window, an instance of Snort is running. To enter more commands on R1, open another R1 terminal by entering the xterm R1 again in the CyberOps Workstation VM terminal window. You may also want to arrange the terminal windows so that you can see and interact with each device.
h. In the new R1 terminal tab, run the tail command with the -f option to monitor the /var/log/snort/alert file in real-time. This file is where snort is configured to record alerts.
[root@sec0ps analyst]# tail -f /var/log/snort/alert
Because no alerts were yet recorded, the log should be empty. However, if you have run this lab before, old alert entries may be shown. In either case, you will not receive a prompt after typing this command. This window will display alerts as they happen.
i. From H5, use the wget command to download a file named Nimda.Amm.exe. Designed to download content via HTTP, wget is a great tool for downloading files from web servers directly from the command line.
[root@secOps analyst]# wget 209.165.202.133:6666/W32.Nimda.Amm.exe
--2017-04-28 17:00:04--  http://209.165.202.133:6666/W32.Nimda.Amm.exe
Connecting to 209.165.202.133:6666... connected.
HTTP request sent, awaiting response... 200 OK
Length: 345088 (337K) [application/octet-stream]
Saving to: 'W32.Nimda.Amm.exe'

W32.Nimda.Amm.exe           100%[==========================================>] 337.00K  --.-KB/s    in 0.02s

2017-04-28 17:00:04 (16.4 MB/s) - 'W32.Nimda.Amm.exe' saved [345088/345088]

[root@secOps analyst]#
What port is used when communicating with the malware web server? What is the indicator?
Was the file completely downloaded?
Did the IDS generate any alerts related to the file download?
j. As the malicious file was transiting R1, the IDS, Snort, was able to inspect its payload. The payload matched at least one of the signatures configured in Snort and triggered an alert on the second R1 terminal window (the tab where tail -f is running). The alert entry is show below. Your timestamp will be different:
04/28-17:00:04.092153 [**] [1:1000003:0] Malicious Server Hit! [**] [Priority: 0] {TCP} 209.165.200.235:34484 -> 209.165.202.133:6666
Based on the alert shown above, what was the source and destination IPv4 addresses used in the transaction?
Based on the alert shown above, what was the source and destination ports used in the transaction?
Based on the alert shown above, when did the download take place?
Based on the alert shown above, what was the message recorded by the IDS signature?
On H5, use the tcpdump command to capture the event and download the malware file again so you can capture the transaction. Issue the following command below start the packet capture:
[root@secOps analyst]# tcpdump –i H5-eth0 –w nimda.download.pcap &
[1] 5633
[root@secOps analyst]# tcpdump: listening on H5-eth0, link-type EN10MB (Ethernet), capture size 262144 bytes
The command above instructs tcpdump to capture packets on interface H5-eth0 and save the capture to a file named nimda.download.pcap.
The & symbol at the end tells the shell to execute tcpdump in the background. Without this symbol, tcpdump would make the terminal unusable while it was running. Notice the [1] 5633; it indicates one process was sent to background and its process ID (PID) is 5366. Your PID will most likely be different.
k. Press ENTER a few times to regain control of the shell while tcpdump runs in background.
l. Now that tcpdump is capturing packets, download the malware again. On H5, re-run the command or use the up arrow to recall it from the command history facility.
[root@secOps analyst]# wget 209.165.202.133:6666/W32.Nimda.Amm.exe
--2017-05-02 10:26:50--  http://209.165.202.133:6666/W32.Nimda.Amm.exe
Connecting to 209.165.202.133:6666... connected.
HTTP request sent, awaiting response... 200 OK
Length: 345088 (337K) [application/octet-stream]
Saving to: 'W32.Nimda.Amm.exe'

W32.Nimda.Amm.exe   100%[===================>] 337.00K  --.-KB/s    in 0.003s

2017-05-02 10:26:50 (105 MB/s) - 'W32.Nimda.Amm.exe' saved [345088/345088]
m. Stop the capture by bringing tcpdump to foreground with the fg Because tcpdump was the only process sent to background, there is no need to specify the PID. Stop the tcpdump process with Ctrl+C. The tcpdump process stops and displays a summary of the capture. The number of packets may be different for your capture.
[root@secOps analyst]# fg
tcpdump -i h5-eth0 -w nimda.download.pcap
^C316 packets captured
316 packets received by filter
0 packets dropped by kernel
[root@secOps analyst]#
n. On H5, Use the ls command to verify the pcap file was in fact saved to disk and has size greater than zero:
[root@secOps analyst]# ls -l
total 1400
drwxr-xr-x 2 analyst analyst   4096 Sep 26  2014 Desktop
drwx------ 3 analyst analyst   4096 Jul 14 11:28 Downloads
drwxr-xr-x 8 analyst analyst   4096 Jul 25 16:27 lab.support.files
-rw-r--r-- 1 root    root    371784 Aug 17 14:48 nimda.download.pcap
drwxr-xr-x 2 analyst analyst   4096 Mar  3 15:56 second_drive
-rw-r--r-- 1 root    root    345088 Apr 14 15:17 W32.Nimda.Amm.exe
-rw-r--r-- 1 root    root    345088 Apr 14 15:17 W32.Nimda.Amm.exe.1
 [root@secOps analyst]#
Note: Your directory list may have a different mix of files, but you should still see the nimda.download.pcap file.
How can be this PCAP file be useful to the security analyst?
Note: The analysis of the PCAP file will be performed in another lab.
Step 2: Tuning Firewall Rules Based on IDS Alerts
In Step 1, you started an internet-based malicious server. To keep other users from reaching that server, it is recommended to block it in the edge firewall.
In this lab’s topology, R1 is not only running an IDS but also a very popular Linux-based firewall called iptables. In this step, you will block traffic to the malicious server identified in Step 1 by editing the firewall rules currently present in R1.
Note: While a comprehensive study of iptables is beyond the scope of this course, iptables basic logic and rule structure is fairly straight-forward.
The firewall iptables uses the concepts of chains and rules to filter traffic.
Traffic entering the firewall and destined to the firewall device itself is handled by the INPUT chain. Examples of this traffic are ping packets coming from any other device on any networks and sent to any one of the firewall’s interfaces.
Traffic originated in the firewall device itself and destined to somewhere else, is handled by the OUTPUT chain. Examples of this traffic are ping responses generated by the firewall device itself.
Traffic originated somewhere else and passing through the firewall device is handled by the FORWARD chain. Examples of this traffic are packets being routed by the firewall.
Each chain can have its own set of independent rules specifying how traffic is to be filtered for that chain. A chain can have practically any number of rules, including no rule at all.
Rules are created to check specific characteristics of packets, allowing administrators to create very comprehensive filters. If a packet doesn’t match a rule, the firewall moves on to the next rule and checks again. If a match is found, the firewall takes the action defined in the matching rule. If all rules in a chain have been checked and yet no match was found, the firewall takes the action specified in the chain’s policy, usually allow the packet to flow through or deny it.
a. In the CyberOps Workstation VM, start a third R1 terminal window.
mininet > xterm R1
b. In the new R1 terminal window, use the iptables command to list the chains and their rules currently in use:
[root@secOps ~]# iptables -L -v
Chain INPUT (policy ACCEPT 0 packets, 0 bytes)
 pkts bytes target     prot opt in     out     source               destination

Chain FORWARD (policy ACCEPT 6 packets, 504 bytes)
 pkts bytes target     prot opt in     out     source               destination

Chain OUTPUT (policy ACCEPT 0 packets, 0 bytes)
 pkts bytes target     prot opt in     out     source               destination

[root@secOps ~]#
What chains are currently in use by R1?
c. Connections to the malicious server generate packets that must transverse the iptables firewall on R1. Packets traversing the firewall are handled by the FORWARD rule and therefore, that is the chain that will receive the blocking rule. To keep user computers from connecting to the malicious server identified in Step 1, add the following rule to the FORWARD chain on R1:
[root@secOps ~]# iptables -I FORWARD -p tcp -d 209.165.202.133 --dport 6666 -j DROP
[root@secOps ~]#
Where:
- -I FORWARD: inserts a new rule in the FORWARD chain.
- -p tcp: specifies the TCP protocol.
- -d 209.165.202.133: specifies the packet’s destination
- –dport 6666: specifies the destination port
- -j DROP: set the action to drop.
d. Use the iptables command again to ensure the rule was added to the FORWARD chain. The CyberOps Workstation VM may take a few seconds to generate the output:
[root@secOps analyst]# iptables -L -v
Chain INPUT (policy ACCEPT 0 packets, 0 bytes)
 pkts bytes target     prot opt in     out     source               destination

Chain FORWARD (policy ACCEPT 0 packets, 0 bytes)
 pkts bytes target     prot opt in     out     source               destination
    0     0 DROP       tcp  --  any    any     anywhere             209.165.202.133      tcp dpt:6666

Chain OUTPUT (policy ACCEPT 0 packets, 0 bytes)
 pkts bytes target     prot opt in     out     source               destination
[root@secOps analyst]#
e. On H5, try to download the file again:
[root@secOps analyst]# wget 209.165.202.133:6666/W32.Nimda.Amm.exe
--2017-05-01 14:42:37-- http://209.165.202.133:6666/W32.Nimda.Amm.exe
Connecting to 209.165.202.133:6666... failed: Connection timed out.
Retrying.

--2017-05-01 14:44:47-- (try: 2) http://209.165.202.133:6666/W32.Nimda.Amm.exe
Connecting to 209.165.202.133:6666... failed: Connection timed out.
Retrying.
Enter Ctrl+C to cancel the download, if necessary.
Was the download successful this time? Explain.
What would be a more aggressive but also valid approach when blocking the offending server?
Part 3: Terminate and Clear Mininet Process
a. Navigate to the terminal used to start Mininet. Terminate the Mininet by entering quit in the main CyberOps VM terminal window.
b. After quitting Mininet, clean up the processes started by Mininet. Enter the password cyberops when prompted.
[analyst@secOps scripts]$ sudo mn –c
[sudo] password for analyst:


