27.2.12 Lab – Interpret HTTP and DNS Data to Isolate Threat Actor (Instructor Version)
Instructor Note: Red font color or gray highlights indicate text that appears in the instructor copy only.
Objectives
In this lab, you will review logs of an exploitation of documented HTTP and DNS vulnerabilities.
- Part 1: Investigate an SQL Injection Attack
- Part 2: Investigate DNS Data Exfiltration
Background / Scenario
MySQL is a popular database used by numerous web applications. Unfortunately, SQL injection is a common web hacking technique. It is a code injection technique where an attacker executes malicious SQL statements to control a web application’s database server.
Domain name servers (DNS) are directories of domain names, and they translate the domain names into IP addresses. This service can be used to exfiltrate data.
Cybersecurity personnel have determined that an exploit has occurred, and data containing PII may have been exposed to threat actors. In this lab, you will use Kibana to investigate the exploits to determine the data that was exfiltrated using HTTP and DNS during the attacks.
Required Resources
- Security Onion virtual machine
Instructions
Part 1: Investigate an SQL Injection Attack
In this part, you will investigate an exploit in which unauthorized access was made to sensitive information that is stored on a web server. You will use Kibana to determine the source of the attack and the information accessed by the attacker.
Step 1: Change the timeframe.
It has been determined that the exploit happened at some time during the month of June 2020. Kibana defaults to displaying data for the last 24 hours. You will need to change the time settings to see the data for the month of June 2020.
a. Start the Security Onion VM and login with the username analyst and the password cyberops.
b. Enter the sudo so-status command to check the status of services. The status for all the services should be OK before starting your analysis. This could take a few minutes.
analyst@SecOnion:~$ sudo so-status
Status: securityonion
  * sguil server                                                       [  OK  ]
Status: seconion-import
  * pcap_agent (sguil)                                                 [  OK  ]
  * snort_agent-1 (sguil)                                              [  OK  ]
  * barnyard2-1 (spooler, unified2 format)                             [  OK  ]
Status: Elastic stack
  * so-elasticsearch                                                   [  OK  ]
  * so-logstash                                                        [  OK  ]
  * so-kibana                                                          [  OK  ]
  * so-freqserver                                                      [  OK  ]
c. After you log in, open Kibana using the shortcut on the Desktop. Login with the username analyst and the password cyberops.
In Security Onion, Kibana has many pre-built dashboards and visualizations for monitoring and analysis. You can also create your own custom dashboards and visualizations catered to monitoring your particular network environment. Note: Your dashboard may not have any results in the last 24 hours.
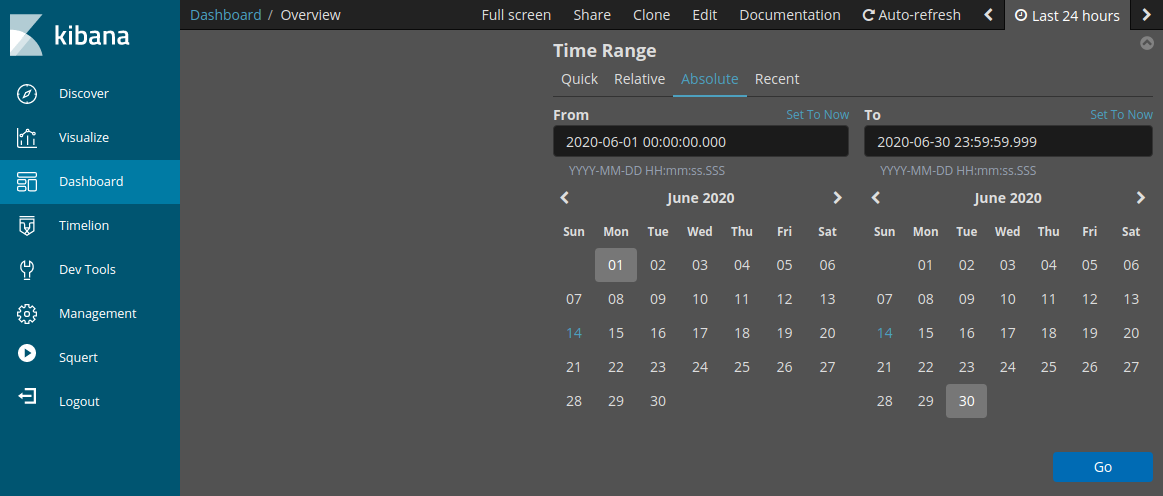
d. In the upper-right corner of the window, click Last 24 hours to change the sample Time Range size. Expand the time range to include the interesting alerts. An SQL injection attack took place in June 2020 so that is what you need to target. Select Absolute under Time Range and edit the From and To times to include the entire month of June in 2020. Click Go to continue.
e. Notice the total number of logs for the entire month of June 2020. Your dashboard should be similar to that shown in the figure. Take a moment to explore the information that is provided by the Kibana interface.
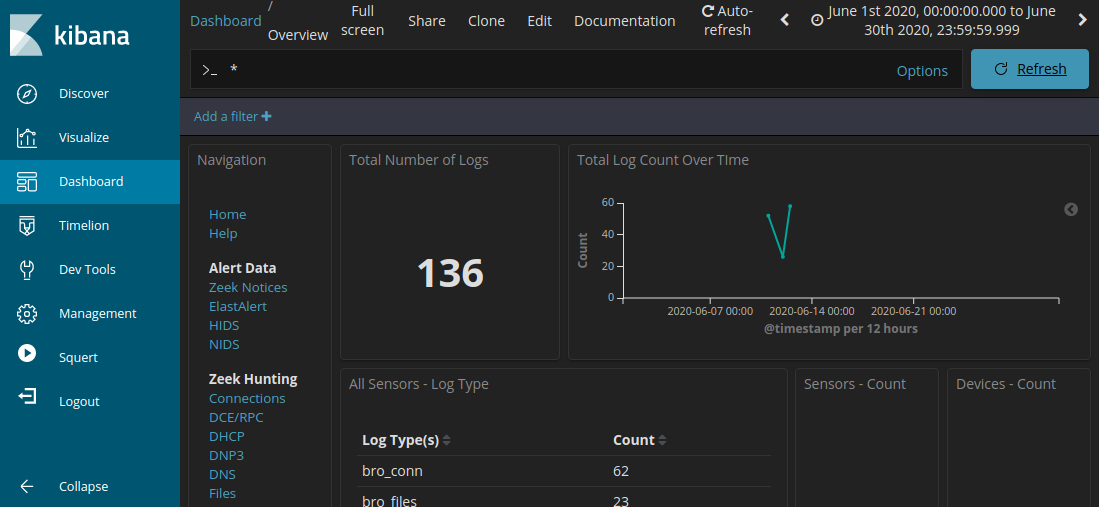
Step 2: Filter for HTTP traffic.
a. Because the threat actor assessed data that is stored on a web server, the HTTP filter is used to select the logs associated with HTTP traffic. Select HTTP under the Zeek Hunting heading, as shown in the figure.
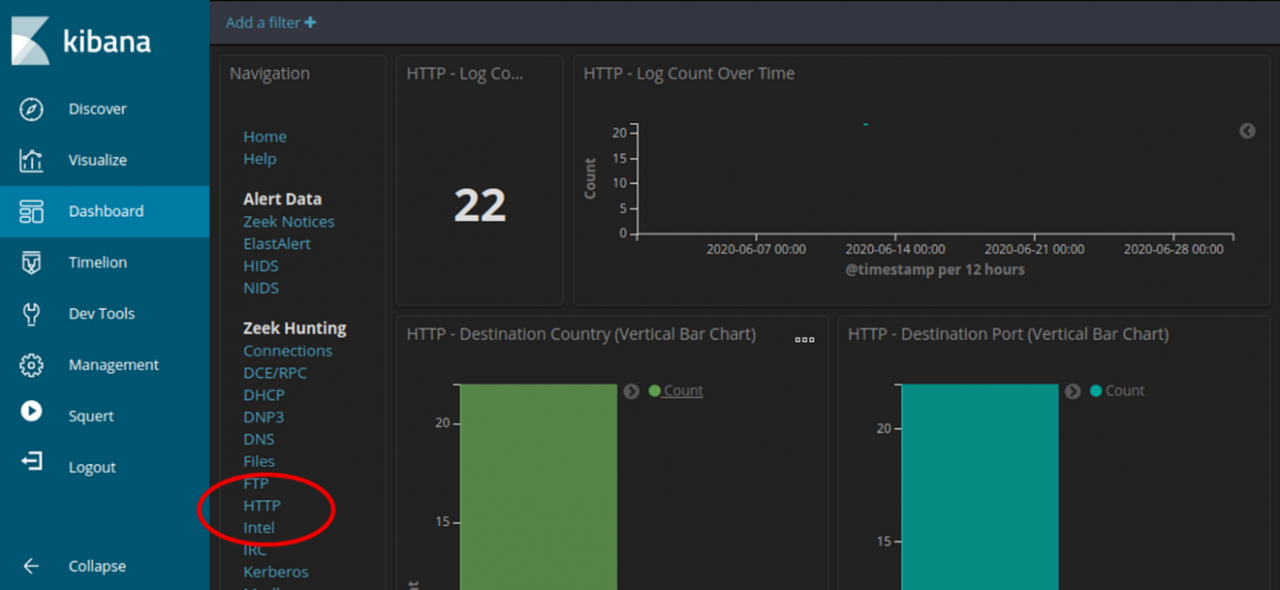
Scroll through the results and answer the following questions:
What is the source IP address?
What is the destination IP address?
What is the destination port number?
b. Scroll down to the HTTP Logs. The results list the first 10 results.
c. Expand the details of the first result by clicking the arrow that is next to the log entry timestamp. Note the information that is available.
What is the timestamp of the first result?
What is the event type?
What is included in the message field? These are details about the HTTP GET request that was made by the client to the server. Focus especially on the uri field in the message text.
What is the significance of this information?
Step 3: Review the results.
a. Some of the information for the log entries is hyperlinked to other tools. Click the value in the alert _id field of the log entry to get a different view on the event.
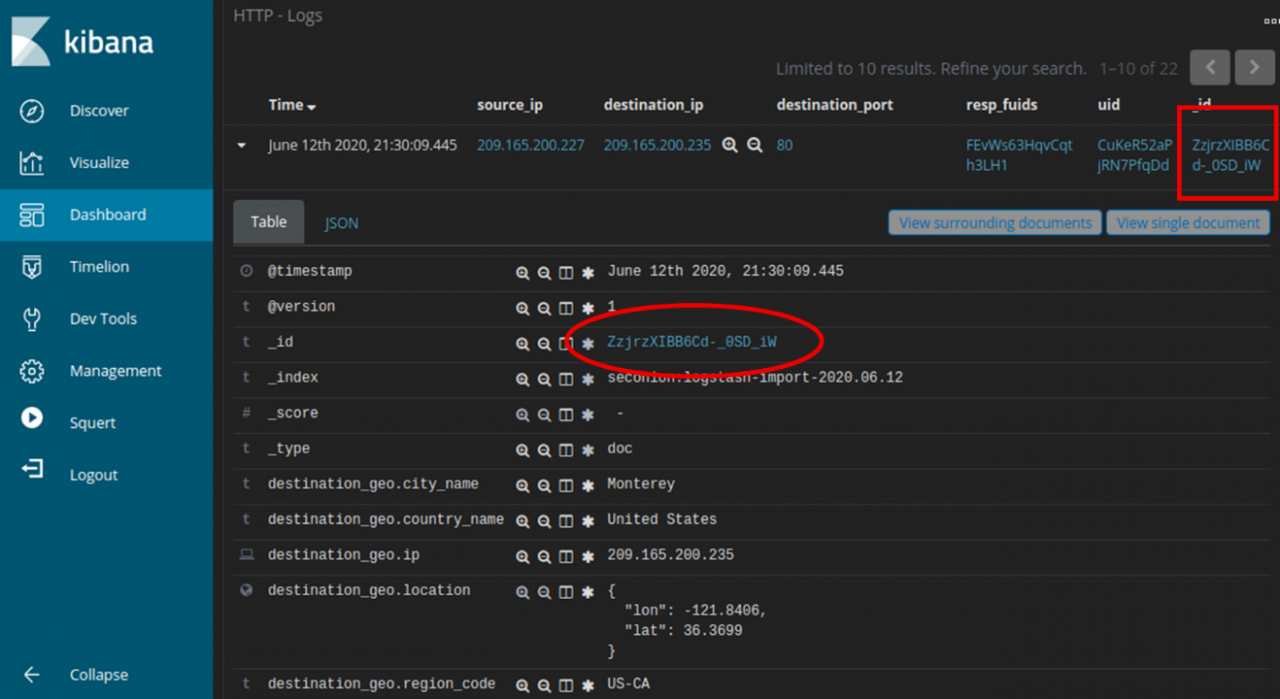
b. The result opens in a new web browser tab with information from capME!. capME! tab is a web interface that allows you to view a pcap transcript. The blue text contains HTTP requests that are sent from the source (SRC). The red text is responses from the destination web server (DST).
c. In the Log entry section, which is at the beginning of the transcript, notice the portion username=’+union+select+ccid,ccnumber,ccv,expiration,null+from+credit_cards+–+&password= indicates that someone may have tried to attack the web browser using SQL injection to bypass authentication. The keywords, union and select, are commands that are used in searching for information in a SQL database. If the input boxes on a web page are not properly protected from illegal input, threat actors can inject SQL search strings or other code that can access data contained in databases that are linked to the web page.
d. Find for the keyword username in the transcript. Use Ctrl-F to open a search box. Use the down arrow button in the search box to scroll through the occurrences that were found.
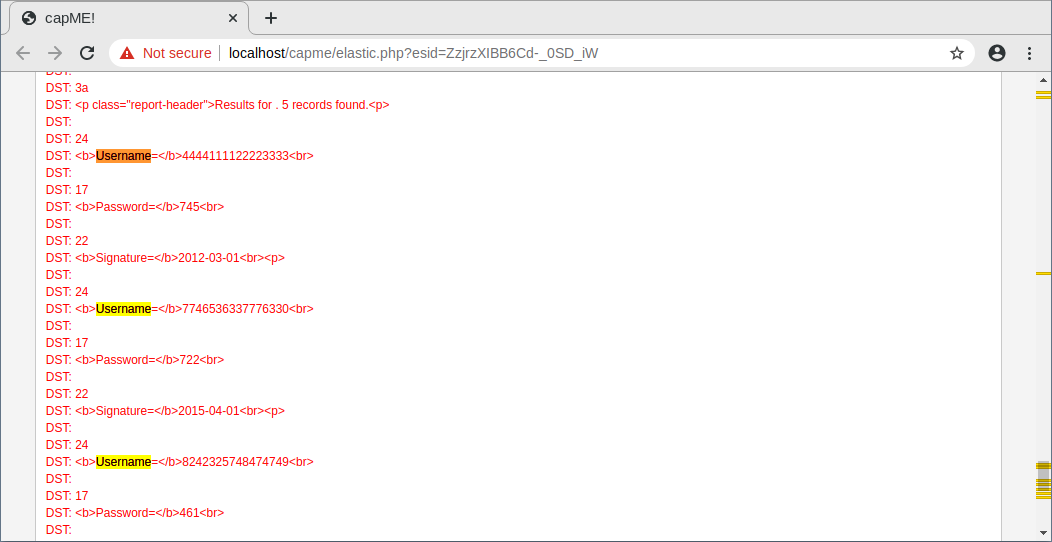
You can see where the term username was used in the web interface that is displayed to the user. However, if you look farther down, something unusual can be found.
What do you see later in the transcript as regards usernames?
Give some examples of a username, password, and signature that was exfiltrated.
Username              Password    Signature
4444111122223333      745         2012-03-01
7746536337776330      722         2015-04-01
8242325748474749      461         2016-03-01
7725653200487633      230         2017-06-01
1234567812345678627   627         2018-11-01
e. Close the capME! tab and return to Kibana.
Part 2: Analyze DNS exfiltration.
A network administrator has noticed abnormally long DNS queries with strange looking subdomains. Your job is to investigate the anomaly.
Step 1: Filter for DNS traffic.
a. From the top of the Kibana Dashboard, clear any filters and search terms and click Home under the Navigation section of the Dashboard. The Time period should still include June 2020.
b. In the same area of the Dashboard, click DNS in the Zeek Hunting section. Notice the DNS Log Count metrics and Destination Port horizontal bar chart.
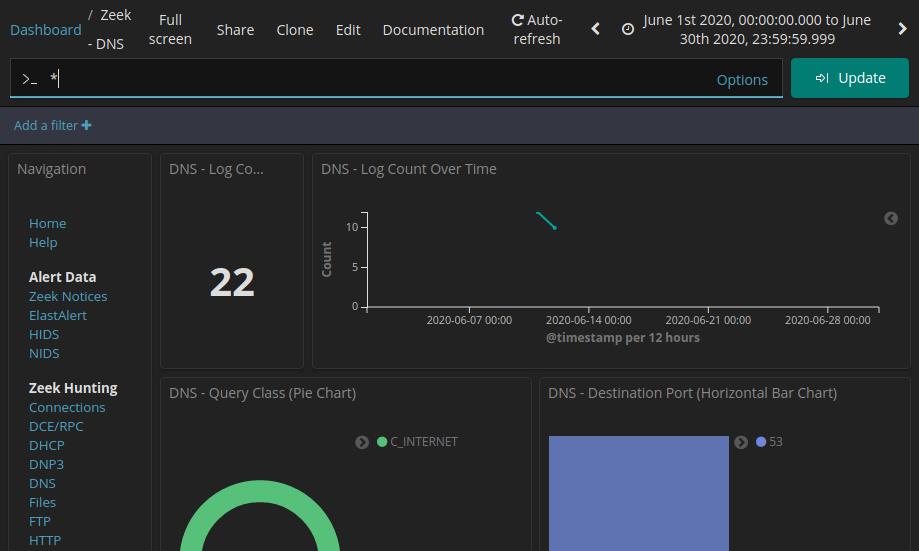
Step 2: Review the DNS-related entries.
a. Scroll down the window. You can see the top DNS query types. You may see address records (A record), IPv6 address Quad A records (AAAA), NetBIOS records (NB) and a pointer records for resolving the hostnames (PTR). You can also see the DNS response codes.
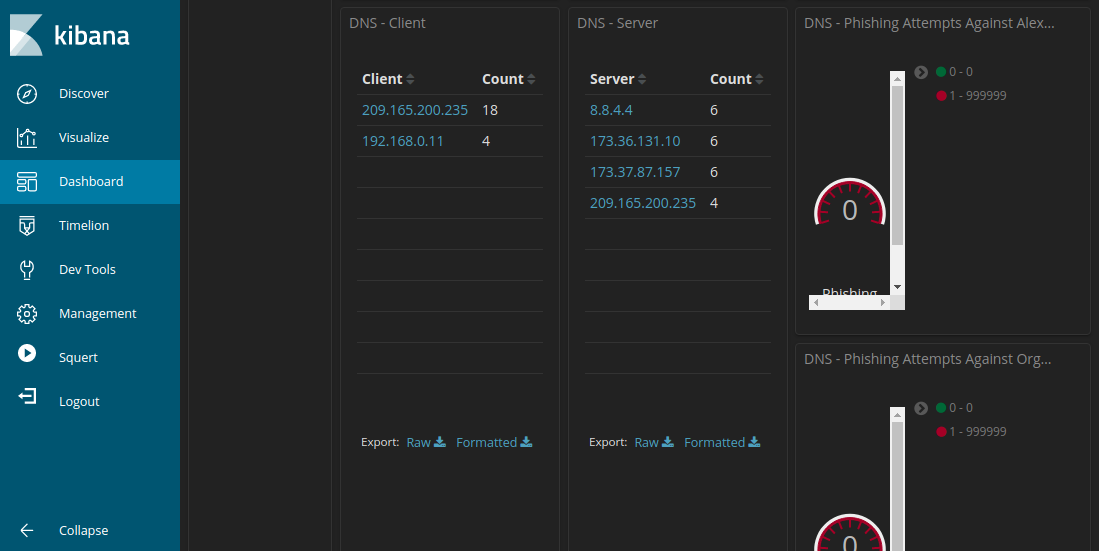
b. By Scrolling further down, you can see a list of the top DNS clients and DNS Servers based on their request and response counts. There is also a metric for number of DNS Phishing attempts, which are also known as DNS pharming, spoofing, or poisoning.
c. Scrolling further down the window you can see a listing of the top DNS queries by domain name. Notice how some of the queries have unusually long subdomains attached to ns.example.com. The domain example.com should be investigated further.
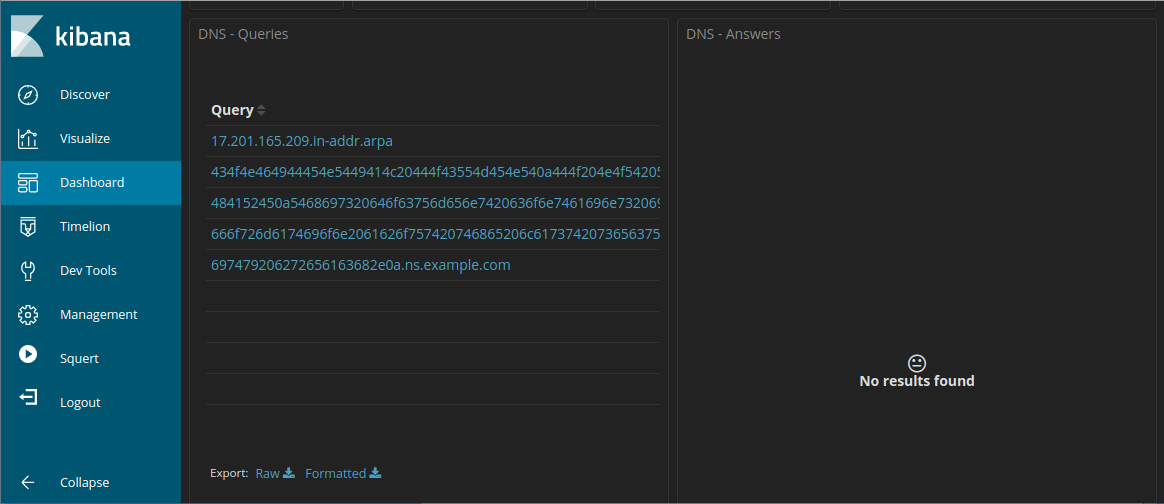
d. Scroll back to the top of the window and enter com in the search bar to filter for example.com and click Update. Note that the number of entries in the Log Count is smaller because the display is now limited to requests to the example.com server.

e. Locate information about the DNS – Client and DNS – Server.
Record the IP addresses of DNS client and server.
Step 3: Determine the exfiltrated data.
a. Continue to scroll further down to see four unique log entries for DNS queries to example.com. Notice how the queries are to suspiciously long subdomains attached to ns.example.com. The long strings of numbers and letters in the subdomains look like text encoded into hexadecimal (0-9, a-f) rather than legitimate subdomain names. Click the Export: Raw download link to download the queries to an external file. A CSV file is downloaded to the /home/analyst/Downloads folder.
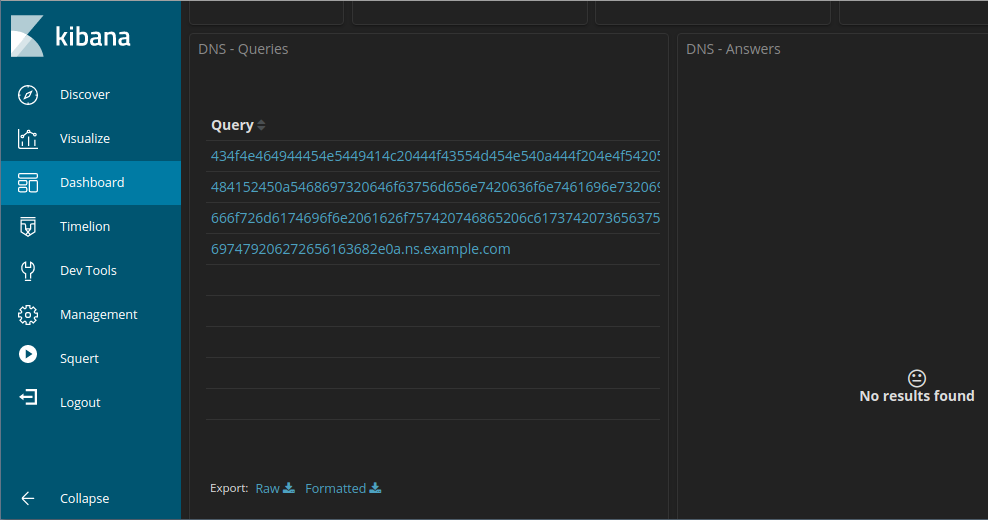
b. Navigate to the /home/analyst/Downloads Open the file using a text editor, such as gedit. Edit the file by deleting the text surrounding the hexadecimal portion of the subdomains, leaving only the hexadecimal characters. Be sure to remove the quotes too. The contents of your file should look like the information below. Save the edited text file with the original file name.
434f4e464944454e5449414c20444f43554d454e540a444f204e4f542053
484152450a5468697320646f63756d656e7420636f6e7461696e7320696e
666f726d6174696f6e2061626f757420746865206c617374207365637572
697479206272656163682e0a
c. In a terminal, use the xxd command to decode the text in the CSV file and save it to a file named secret.txt. Use cat to output the contents of secret.txt to the console.
analyst@SecOnion:~/Downloads$ xxd -r -p "DNS - Queries.csv” > secret.txt
analyst@SecOnion:~/$ cat secret.txt
Were the subdomains from the DNS queries subdomains? If not, what is the text?
DO NOT SHARE
This document contains information about the last security breach.
What does this result imply about these particular DNS requests? What is the larger significance?
What may have created these encoded DNS queries and why was DNS selected as the means to exfiltrate data?

