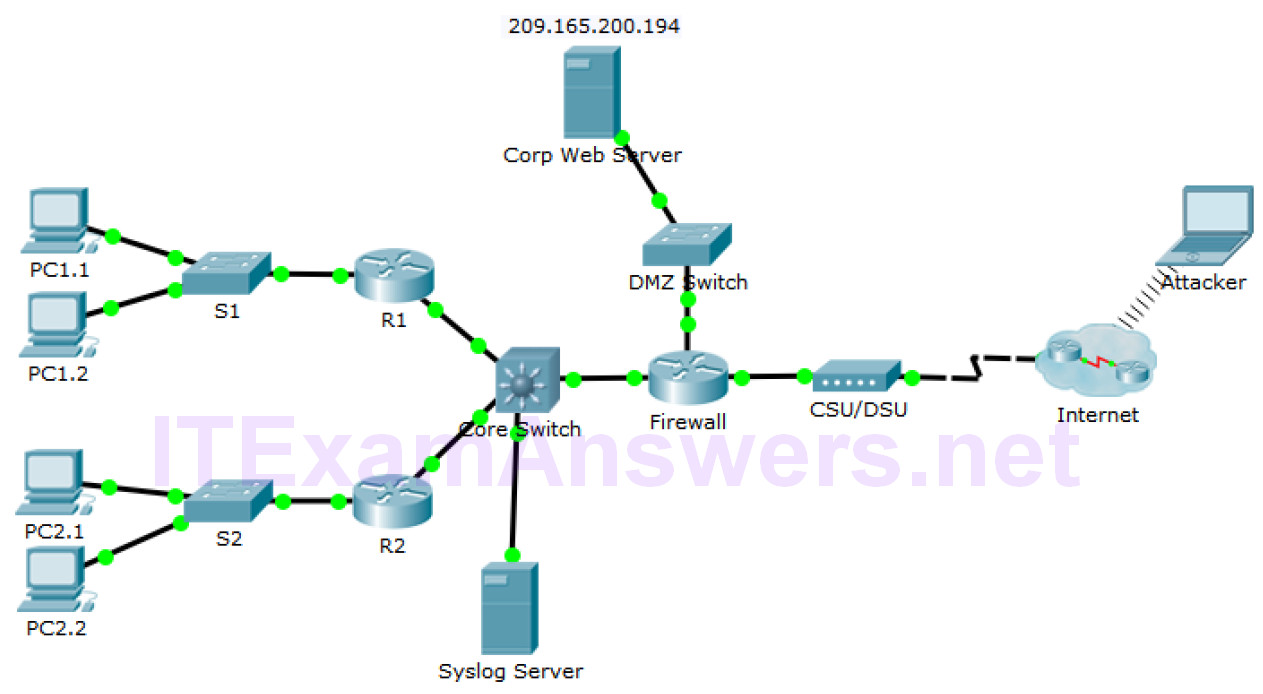
Topology

Objectives
- Part 1: Use syslog to capture log files from multiple network devices
- Part 2: Observe AAA user access logging
- Part 3: Observe NetFlow information
Background / Scenario
In this activity, you will use Packet Tracer to view network data generated by syslog, AAA, and NetFlow.
Part 1: View Log Entries with Syslog
Step 1: The syslog Server
Syslog is a messaging system designed to support remote logging. Syslog clients send log entries to a syslog server. The syslog server concentrates and stores log entries. Packet Tracer supports basic syslog operations and can be used for demonstration. The network includes a syslog server and syslog clients. R1, R2, Core Switch, and the Firewall are syslog clients. These devices are configured to send their log entries to the syslog server. The syslog server collects the log entries and allows them to be read.
Log entries are categorized by seven severity levels. Lower levels represent more serious events. The levels are: emergencies (0), alerts (1), critical (2), errors (3), warnings (4), notifications (5), informational (6), and debugging (7). Syslog clients can be configured to ship log entries to syslog servers based on the severity level.
a. Click the Syslog Server to open its window.
b. Select the Services tab and select SYSLOG from the list of services shown on the left.
c. Click On to turn on the Syslog service.
d. Syslog entries coming from syslog clients will be shown in the window on the right. Currently, there are no entries.
e. Keep this window open and visible and move on to Step 2.
Step 2: Enable Syslog.
The devices are already configured to send log messages to the syslog server, but Packet Tracer only supports the logging for the debugging severity level with syslog. Because of that, we must generate debug level messages (level 7) so they can be sent to the syslog server.
a. Click R1 > CLI tab.
b. Press Enter to get a command prompt and enter the command enable.
c. Enter the command debug eigrp packets to enable EIGRP debugging. The command line console will immediately fill with debug messages.
d. Return to the Syslog Server window. Verify that log entries appear on the syslog server.
e. After a few messages have been logged, click the radio button to turn the syslog service Off.
What is some of the information that is included in the syslog messages that are being displayed by the Syslog Server? ___________________________________________________________________
f. Close the R1 device window.
Part 2: Log User Access
Another important type of log relates to user access. Having records of user logins is crucial for troubleshooting and traffic analysis. Cisco IOS supports Authentication, Authorization and Accounting (AAA). With AAA, it is possible not only to delegate the user validation task to an external server but also to log activities.
TACACS+ is a protocol designed to allow remote authentication through a centralized server.
Packet Tracer offers basic AAA and TACACS+ support. R2 is also configured as a TACACS+ server. R2 will ask the server if that user is valid by verifying username and password, and grant or deny access based on the response. The server stores user credentials and is also able to log user login transactions. Follow the steps below to log in to R2 and display the log entries related to that login:
a. Click the Syslog Server to open its window.
b. Select the Desktop tab and select AAA Accounting. Leave this window open.
c. Click R2 > CLI.
d. Press Enter to get a command prompt. R2 will ask for username and password before granting access to its CLI. Enter the following user credentials: analyst and cyberops as the username and password, respectively.
e. Return to the Syslog Server’s AAA Accounting Records window.
What information is in the log entry? ___________________________________________________________________
f. On R2, enter the logout command.
What happened in the AAA Accounting window? ___________________________________________________________________
Part 3: NetFlow and Visualization
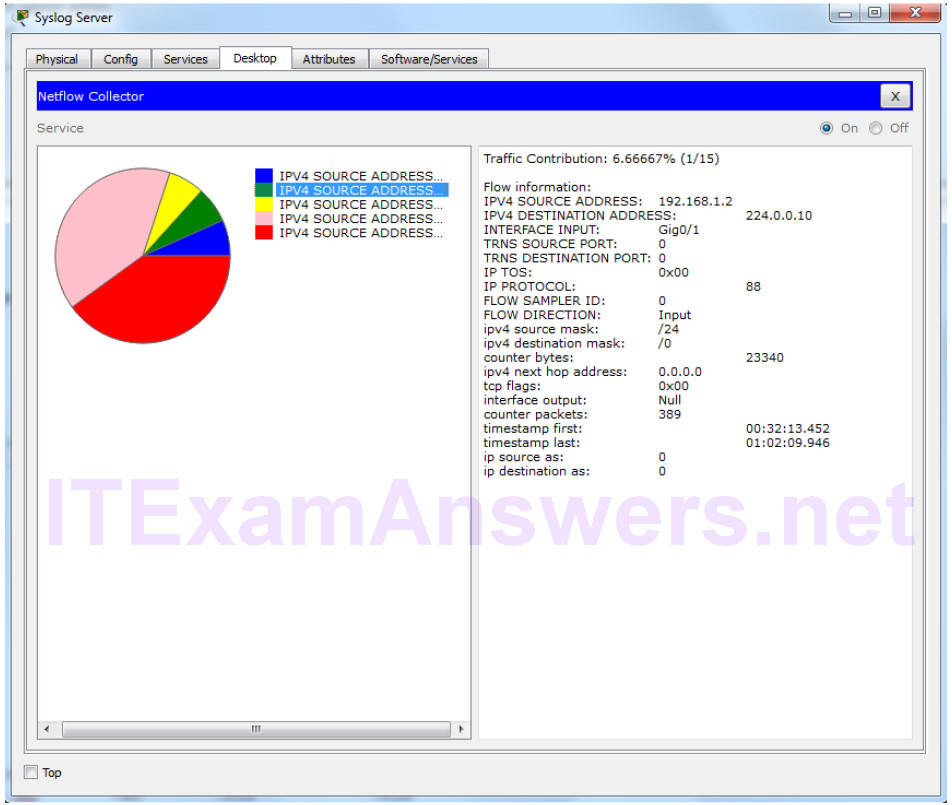
In the topology, the Syslog server is also a NetFlow collector. The firewall is configured as a NetFlow exporter.
a. Click the Syslog Server to bring up its window. Close the AAA Accounting Records window.
b. From the Desktop tab, select Netflow Collector. The NetFlow collector services should be turned on.
c. From any PC, ping the Corp Web Server at 209.165.200.194. After a brief delay, the pie chart will update to show the new traffic flow.
Note: The pie charts displayed will vary based on the traffic on the network. Other packets flows, such as EIGRP-related traffic, are being sent between devices. NetFlow is capturing these packets and exporting statistics to the NetFlow Collector. The longer NetFlow is allowed to run on a network, the more traffic statistics will be captured.

Reflection
While the tools presented in this activity are useful, each one has its own service and may need to run on totally different devices. A better way, explored later in the course, is to have all the logging information be concentrated under one tool, allowing for easy cross-reference and powerful search capabilities. Security information and event management (SIEM) platforms can gather log files and other information from diverse sources and integrate the information for access by a single tool.
